10-K: Annual report [Section 13 and 15(d), not S-K Item 405]
Published on September 10, 2026
UNITED STATES SECURITIES AND EXCHANGE COMMISSION
Washington, D.C. 20549
FORM
For the fiscal year ended
OR
For the transition period from ________ to ________
Commission File Number:

(Exact name of registrant as specified in its charter)
(State of Incorporation) |
|
(IRS Employer I.D. No.) |
(Address of principal executive offices) (Zip code)
(
(Registrant’s telephone number, including area code)
Securities registered pursuant to Section 12(b) of the Exchange Act:
Title of each class |
Trading Symbol(s) |
Name of each exchange on which registered |
Securities registered pursuant to section 12(g) of the Act: None
Indicate by check mark if the registrant is a well-known seasoned issuer, as defined in Rule 405 of the Securities Act.
Indicate by check mark if the registrant is not required to file reports pursuant to Section 13 or Section 15(d) of the Act. Yes ☐
Indicate by check mark whether the registrant (1) has filed all reports required to be filed by Section 13 or 15(d) of the Securities Exchange Act of 1934 during the preceding 12 months (or for such shorter period that the registrant was required to file such reports), and (2) has been subject to such filing requirements for the past 90 days.
Indicate by check mark whether the registrant has submitted electronically every Interactive Data File required to be submitted pursuant to Rule 405 of Regulation S-T (§ 232.405 of this chapter) during the preceding 12 months (or for such shorter period that the registrant was required to submit such files).
Indicate by check mark whether the registrant is a large accelerated filer, an accelerated filer, a non-accelerated filer, smaller reporting company, or an emerging growth company. See the definitions of “large accelerated filer,” “accelerated filer,” “smaller reporting company,” and “emerging growth company” in Rule 12b-2 of the Exchange Act.
Large accelerated filer |
☐ |
|
☑ |
|
Non-accelerated filer |
☐ |
|
Smaller reporting company |
|
Emerging growth company |
If an emerging growth company, indicate by check mark if the registrant has elected not to use the extended transition period for complying with any new or revised financial accounting standards provided pursuant to Section 13(a) of the Exchange Act. ☐
Indicate by check mark whether the registrant has filed a report on and attestation to its management’s assessment of the effectiveness of its internal control over financial reporting under Section 404(b) of the Sarbanes-Oxley Act (15 U.S.C. 7262(b)) by the registered public accounting firm that prepared or issued its audit report.
If securities are registered pursuant to Section 12(b) of the Act, indicate by check mark whether the financial statements of the registrant included in the filing reflect the correction of an error to previously issued financial statements.
Indicate by check mark whether any of those error corrections are restatements that required a recovery analysis of incentive-based compensation received by any of the registrant’s executive officers during the relevant recovery period pursuant to §240.10D-1(b). ¨
Indicate by check mark whether the registrant is a shell company (as defined in Rule 12b-2 of the Exchange Act). Yes. ☐ No.
Aggregate market value of registrant’s common stock held by non-affiliates of the registrant on December 31, 2025, based upon the closing price of Common Stock on such date as reported by the New York Stock Exchange was $
As of August 28, 2026, the registrant had
DOCUMENTS INCORPORATED BY REFERENCE
Portions of the Proxy Statement for the 2026 Annual Meeting of Shareholders, scheduled to be held on November 12, 2026, are incorporated into Part III.
GOLD.COM, INC. AND SUBSIDIARIES
ANNUAL REPORT ON FORM 10-K
For the Year Ended June 30, 2026
TABLE OF CONTENTS
|
|
|
|
Page |
PART I |
|
|
|
|
|
Item 1. |
Description of Business |
|
3 |
|
Item 1A. |
Risk Factors |
|
12 |
|
Item 1B. |
Unresolved Staff Comments |
|
31 |
|
Item 1C. |
Cybersecurity |
|
32 |
|
Item 2. |
Properties |
|
33 |
|
Item 3. |
Legal Proceedings |
|
33 |
|
Item 4. |
Mine Safety Disclosures |
|
34 |
|
|
|
|
|
PART II |
|
|
|
|
|
Item 5. |
Market for Registrant's Common Equity, Related Stockholder Matters and Issuer Purchases of Equity Securities |
|
34 |
|
Item 6. |
[Reserved] |
|
36 |
|
Item 7. |
Management's Discussion and Analysis of Financial Condition and Results of Operations |
|
37 |
|
Item 7A. |
Quantitative and Qualitative Disclosures About Market Risk |
|
66 |
|
Item 8. |
Financial Statements and Supplemental Data |
|
67 |
|
Item 9. |
Changes in and Disagreements with Accountants on Accounting and Financial Disclosure |
|
123 |
|
Item 9A. |
Controls and Procedures |
|
123 |
|
Item 9B. |
Other Information |
|
124 |
|
Item 9C. |
Disclosure Regarding Foreign Jurisdictions that Prevent Inspections |
|
124 |
|
|
|
|
|
PART III |
|
|
|
|
|
Item 10. |
Directors, Executive Officers and Corporate Governance |
|
125 |
|
Item 11. |
Executive Compensation |
|
125 |
|
Item 12. |
Security Ownership of Certain Beneficial Owners and Management and Related Stockholder Matters |
|
125 |
|
Item 13. |
Certain Relationships and Related Transactions, and Director Independence |
|
125 |
|
Item 14. |
Principal Accountant Fees and Services |
|
125 |
|
|
|
|
|
PART IV |
|
|
|
|
|
Item 15. |
Exhibits and Financial Statement Schedules |
|
126 |
|
Item 16. |
Form 10-K Summary |
|
128 |
Signatures |
|
|
|
129 |
2
PART I
ITEM 1. DESCRIPTION OF BUSINESS
Overview
Gold.com, Inc. also referred to (together with its subsidiaries) as "we", "us", the "Company", and "Gold.com", is a fully integrated precious metals company that offers an array of gold, silver, platinum, palladium, and copper bullion, numismatic coins, and related products to wholesale and retail customers via a portfolio of channels. The Company conducts its operations through three complementary segments:
Gold.com believes it has one of the largest customer bases in each of its markets and provides one of the most comprehensive offerings of products and services in the precious metals trading industry. Our global customer base, spanning four continents, includes mints, manufacturers and fabricators, refiners, coin and bullion dealers, e-commerce retailers, banks and other financial institutions, commodity brokerage houses, industrial users of precious metals, investors, collectors, and retail customers.
We believe our businesses largely function independently of the price movement of the underlying commodities. However, factors such as global economic activity or uncertainty and inflationary trends, which affect market volatility, have the potential to impact demand, supply, volumes, and margins.
History
Gold.com was founded in 1965 as A-Mark Precious Metals, Inc. and has grown into a significant participant in the bullion and coin market. Over the years, the Company has been steadily expanding its products and services. In 1986, the Company became an authorized purchaser of gold and silver bullion coins struck by the United States Mint. Similar arrangements with other sovereign mints followed, so that by the early 1990s, the Company had (and continues to have) relationships with all major sovereign mints offering bullion coins and bars internationally. In 2005, 80% of the Company was acquired by Spectrum Group International, Inc., which acquired the balance of the Company in 2011. In 2014, the Company was then spun-off and became a publicly traded company.
The Company began to develop a range of ancillary services in 2015 that has since grown to include, among others, A-M Global Logistics, LLC (“AMGL”), our Las Vegas based precious metals depository and distribution center, which is complemented by a second facility in proximity to the Dallas Fort Worth International Airport. Through the Company’s AM&ST Associates, LLC (“AMST”) subsidiary, the Company acquired full ownership of Silver Towne Mint in 2021.
The Company's transition to a vertically integrated precious metals company began with the 2017 acquisition of Goldline, Inc. and continued with its foundational acquisition in 2021 of the remaining equity interests in JM Bullion, Inc. it did not own at the time.
The Company’s international operations have grown over the last several years through a series of organic investments and acquisitions to include Wholesale Sales and Direct-to-Consumer operations in Canada, Europe, as well as Asia, with a specific focus on Hong Kong and Singapore.
In February 2025, the Company acquired the successor company to Spectrum Group International, Inc., its former parent company and the owner of Stack’s Bowers Galleries and Spectrum Wine Auctions. This acquisition expanded the Company’s operations into the collectible coin and currency market and was followed by complementary acquisitions. (As used herein, and as the context may require, the term "SGI" refers to Spectrum Group International, Inc. and its successor company Spectrum Group International, LLC.)
In December 2025, the Company changed its name to Gold.com, and in January 2026 purchased Monex Deposit Company. The Company expanded its minting operations in April 2026 through the acquisition of the remaining equity interests of Sunshine Minting, Inc.
3
Competitive Advantages
Through strategic relationships with our customers and suppliers and vertical integration across our markets, we seek to grow our business volume, expand our presence in non-U.S. markets around the globe, and enlarge our offering of complementary products and services. We seek to continue our expansion by building on its strengths and what it perceives to be its competitive advantages. These include:
Growth Strategy
As we pursue strategic growth, we are focused on:
4
Business Segments
The Company conducts its operations in three reportable segments: (i) Wholesale Sales & Ancillary Services, (ii) Direct-to-Consumer, and (iii) Secured Lending. See Note 19 to the Company’s consolidated financial statements for further information regarding our reportable segments.
Wholesale Sales & Ancillary Services
The Company operates through several business units that comprise the Wholesale Sales & Ancillary Services segment, including Wholesale Sales, Storage and Logistics, and Mint.
Wholesale Sales. We sell thousands of different products through our Wholesale Sales business, including gold and silver coins from around the world and gold, silver, platinum and palladium bars and ingots in a variety of weights, shapes, and sizes. Our customers include coin and bullion dealers, banks and other financial institutions, commodity brokerage houses, manufacturers, investors, investment advisors, and collectors who qualify as “eligible commercial entities” and “eligible contract participants,” as those terms are defined in the Commodity Exchange Act. We also sell gold, silver, platinum, and palladium to industrial and commercial users, including coin fabricators such as mints and industrial manufacturers, encompassing electronics and component parts companies and refiners.
We are an authorized distributor (and, in the case of the United States Mint, an authorized purchaser) of gold and silver coins for all of the major sovereign mints and various private mints. The sovereign mints include the United States Mint, the Australian (Perth) Mint, the Austrian Mint, the Royal Canadian Mint, the China Mint, Banco de Mexico, the South African Mint (Rand Refinery) and the Royal Mint (United Kingdom). We purchase and take delivery of coins from the mints for resale to coin dealers, financial institutions, and other qualified purchasers.
Our distribution and purchase agreements with the mints are non-exclusive and may be terminated by the mints at any time, although in practice our relationships with the mints are long-standing, in some cases, as with the United States Mint, extending back for over 35 years. In some cases, we have developed exclusive products with sovereign and private mints for distribution through our dealer network.
Orders are taken telephonically and on an electronic trading platform that can be accessed by qualified wholesale customers at www.amark.com. Pricing is generally based on screen quotes for bullion transactions in the spot market, with two-day settlement, although special pricing and extended settlement terms are also available. Almost all customers take physical delivery of the precious metal. Product is shipped upon receipt of payment, except where the purchase is financed under credit arrangements between the Company and the customer. We have relationships with precious metal depositories around the world to facilitate shipment of product from our inventory to the customer, in many cases for next day delivery. Product may either be shipped to the customer's location or delivered to a depository or other storage facility designated by the customer. The Company also periodically loans metals to customers on a short-term consignment basis and may charge interest fees based on the value of the metals loaned.
5
We engage in commodity hedging as well as borrowing and lending transactions in support of our Wholesale Sales operations. We hedge the commodity risk on our inventory in order to protect us from market price fluctuations. We maintain relationships with major market-makers and multiple futures brokers in order to provide a variety of alternatives for our hedging needs. Our traders employ a combination of future and forward contracts to hedge our market exposure. Because we seek to substantially hedge our market exposure, we believe that our business largely functions independently of the price movements of the underlying commodities. Through our hedging activities, we may also earn contango yields, in which futures price are higher than the current spot prices, or backwardation yields, in which futures prices are lower than the spot prices. We also offer precious metals price quotes in a number of foreign currencies.
We engage in precious metals borrowing and lending transactions and other customized financial transactions with or on behalf of our customers and other counterparties. These arrangements range from simple hedging structures to complex inventory finance arrangements and forward purchase and sale structures, tailored to the needs of our customers.
We promote and sell products and services to international markets through several strategic locations:
We acquired SGI in February 2025. SGI is the parent company of Stack's Bowers Galleries, which is one of the world's largest rare coin and currency auction houses and a leading wholesale and retail dealer specializing in numismatic and bullion products. SGI is also the majority owner of Spectrum Wine, a global auctioneer, retailer, and storage provider of fine and rare wine. SGI's financial results and metrics attributable to its wholesale operations are included in our Wholesale Sales & Ancillary Services segment and the financial results and metrics attributable to its auction and retail operations are included in our Direct-to-Consumer segment.
In February 2025, the Company acquired the remaining outstanding equity interests in Pinehurst Coin Exchange, Inc. (“Pinehurst”) it did not previously own. Pinehurst is a leading precious metals broker that services the wholesale and retail marketplace and is one of the nation’s largest e-commerce retailers of modern and numismatic coins on eBay. Pinehurst markets a broad range of bullion and is a leader in selling coins produced by the U.S. Mint, the Royal Canadian Mint, and other highly regarded sovereign mints that have been evaluated by leading grading agencies. Pinehurst's financial results and metrics attributable to its wholesale operations are included in our Wholesale Sales & Ancillary Services segment and the financial results and metrics attributable to its retail operations are included in our Direct-to-Consumer segment.
Storage and Logistics. Through our A-M Global Logistics, LLC (“AMGL”) and Transcontinental Depository Services, LLC ("TDS") subsidiaries, we provide secured storage and logistics solutions for precious metals and numismatic coins for financial institutions, dealers, investors, and collectors worldwide. AMGL provides secure storage and comprehensive logistics solutions to our customers through our depository in Las Vegas, Nevada. Our AMGL facility, located in the Harry Reid International Airport, comprises approximately 25,000 square feet and utilizes autonomous processing to enhance operational efficiency and maintain premium quality control. TDS contracts on behalf of our clients with independent secure storage facilities in the United States, Canada, Europe, Singapore, and Hong Kong, for either fully segregated or allocated storage. TDS's marketing efforts are conducted both in conjunction with our trading operations and independently, including through its dedicated website www.tdsvaults.com. We also operate a 25,000 square foot storage facility in Texas near the Dallas Fort Worth International Airport through our Direct-to-Consumer subsidiary JM Bullion, Inc.
Minting and Refining. Through its wholly-owned subsidiary AM&ST Associates, LLC (“AMST”), the Company owns the minting operations of the Silver Towne Mint, which is an Indiana-based fabricator of silver bullion products. In April 2026, we acquired the remaining equity interests of Sunshine Minting, Inc. a leading domestic and global supplier of precious metal mint products with manufacturing facilities in Nevada, as well as a joint venture in Shanghai, China. These minting and refining operations allow us to provide a diverse product selection to our customers and greater pricing stability within the supply chain, and give us increased access to fabricated products during volatile market environments. Gold.com has leveraged the fabrication capabilities at these mints to introduce new custom products for individual customers.
Although the Company is the Silver Towne Mint’s primary customer, it also markets its products at www.silvertownemint.com. Sunshine Minting's products are marketed through its website, sunshineminting.com. Our minting operations are ISO 9000:2015 certified which allows all products produced to be accepted into individual retirement accounts.
6
Direct-to-Consumer
The Company operates its Direct-to-Consumer segment through its wholly-owned subsidiaries JM Bullion, Inc. (“JMB”), Goldline, Inc. (“Goldline”), Spectrum Group International, LLC ("SGI"), Pinehurst Coin Exchange, Inc. ("Pinehurst"), AMS Holding, LLC ("AMS"), AM LPM Singapore PTE, Ltd, Monex Deposit Company ("Monex"), through its investment in Silver Gold Bull, Inc. ("SGB") and through its subsidiary Precious Metals Purchasing Partners, LLC ("PMPP"). The Company’s Direct-to-Consumer segment expands the Company’s distribution capabilities with a retail distribution channel. It diversifies the products and services offered to the Company’s retail customers by providing them access to the Company’s wider assortment of precious metal coins and bars, as well as AMGL's storage and logistics services and TDS’s storage and asset protection services.
JMB
JMB is a leading internet retailer of precious metal products that it sells through its proprietary websites.
Products. JMB’s products consist primarily of coins, rounds, and bars. Coins are minted by a sovereign government, are legal currency and have a face value, although the face value is typically less than the value of their precious metal content. Rounds are coin-like objects with thematic designs minted by private mints, have no face value and are not legal currency, and their value is solely based upon their precious metal content. Bars are ingot-shaped precious metal objects that are usually produced by private mints. Like rounds, bars have no face value, are not legal currency and are valued based on their precious metal content. Coins, rounds, and bars are made from silver, gold, platinum, or palladium and in some cases copper. JMB occasionally sells jewelry products fashioned around coins or rounds as well.
JMB offers approximately 8,000 different products, measured by stock keeping units or SKUs, on its websites during a fiscal year. This number can vary over time, particularly when demand is high. As a service to its customers, JMB makes available for sale on its websites protective accessories for precious metal products, including acrylic coin holders and capsules, coin tubes and silver bar tubes.
JMB owns and operates numerous websites targeting specific niches within the precious metals retail market, including JMBullion.com, ProvidentMetals.com, Silver.com, CyberMetals.com, GoldPrice.org, SilverPrice.org, BGASC.com, BullionMax.com, and Gold.com. GoldPrice.org and SilverPrice.org publish data on precious metal and cryptocurrency pricing and generate leads for JMB's other websites.
Through JMB's CyberMetals online platform, customers can purchase and sell fractional shares of digital gold, silver, platinum, and palladium bars in a range of denominations. CyberMetals’ customers have the option to convert their digital holdings to fabricated precious metals products via an integrated redemption flow with JMB. These products may be designated for storage by the Company or shipped directly to the customer.
Customers may order product on each of the JMBullion.com, BGASC.com, BullionMax.com, ProvidentMetals.com and Silver.com websites. While each of these sites appeals to a different customer clientele and may from time to time have slightly different product offerings, all orders are processed in the same manner. Customers may place their orders online, or they may use the toll-free telephone number available on the websites to order through a customer representative. The SilverPrice.org and GoldPrice.org websites provide real time price information on silver, gold, and cryptocurrencies. Although customers cannot order product on these websites, the websites direct visitors to JMBullion.com for placing orders.
JMB utilizes an internally developed search engine optimization strategy to drive traffic to its websites, particularly to JMBullion.com. JMB also pays for placement on the major search engines and advertising platforms, including Google, Bing, Apple, and Facebook, employing internally developed strategies to reach a targeted audience and to optimize the cost effectiveness of paid for searches.
JMB's Direct-to-Consumer Purchase Program. JMB also offers to purchase precious metal products through its websites. With this program, JMB provides collectors of precious metal products with a means to dispose of their holdings at transparent and competitive prices. Generally, JMB will indicate on its websites the products that it is interested in purchasing, and a collector seeking to sell such products may arrange the sale online. Alternatively, the collector may call a customer representative using the toll-free number on the website and arrange a sale by telephone.
The Direct-to-Consumer Purchase Program is a source of inventory for JMB, which enables JMB to acquire product for resale at a discount to dealer prices.
Logistics. The Company's main distribution facility in Las Vegas, Nevada, together with its ancillary facility in Dallas, Texas, handle the back end logistics for the Company's Direct-to-Consumer Purchase Program and the secured storage for CyberMetals' precious metals.
7
Goldline
Goldline, acquired by the Company in August 2017, is a direct retailer of precious metals to the investor community. Goldline markets its precious metal products on television, radio, podcasts, and the internet, as well as through customer service outreach, particularly to Goldline’s repeat customers. Online orders are taken on an electronic trading platform that can be accessed by qualified retail customers at www.goldline.com.
Goldline customers are required to enter into an account agreement that specifies the terms and conditions of purchase and explains the availability of certain programs and services offered by Goldline to its customers.
Products. Goldline offers a variety of products from gold, silver, and platinum bullion in the form of bars and coins, as well as rare coins.
Goldline's and SGB's Direct-to-Consumer Purchase Program. Through Precious Metals Purchasing Partners, LLC ("PMPP"), a joint venture between Goldline and SGB, Goldline and SGB acquire precious metals from their retail customers in order to diversify their supply of product offerings and provide discounted pricing to their affiliates. This program provides Goldline's and SGB's customers with a means to monetize their holdings efficiently and at competitive prices.
Intellectual Property. AM IP Assets, LLC ("AMIP"), a wholly-owned subsidiary of Goldline, manages certain intellectual property of Goldline, including customer lists and a sales lead database.
SGB
The Company acquired its initial ownership interest in SGB in 2014, increasing its investment to 55.4% in June 2024. SGB is a leading e-commerce precious metals retailer in Canada. The Company's investment in SGB expands the Company's direct-to-consumer footprint in the international market.
Through its website, SilverGoldBull.com, SGB offers a variety of products from gold, silver, platinum, and palladium in the form of bars, coins and rounds, as well as certified coins from mints around the world.
SGI
SGI, which the Company acquired in February 2025, is the parent company of Stack's Bowers Galleries, one of the world's largest rare coin and currency auction houses and a leading wholesale and retail dealer specializing in numismatic and bullion products. Its auction services unit conducts in-person, internet and specialized auctions of consigned and owned items and has sold a wide range of the most important rarities and numismatic collections over its distinguished history. SGI's financial results and metrics attributable to its wholesale operations are included in our Wholesale Sales & Ancillary Services segment and the financial results and metrics attributable to its auction and retail operations are included in our Direct-to-Consumer segment.
Pinehurst
In February 2025, the Company acquired the remaining equity interests in Pinehurst it did not previously own. Pinehurst is a leading precious metals broker that services the wholesale and retail marketplace and is one of the nation’s largest e-commerce retailers of modern and numismatic coins on eBay. Pinehurst operates the www.PinehurstCoins.com and www.ModernCoinMart.com websites. Pinehurst's financial results and metrics attributable to wholesale operations are included in our Wholesale Sales & Ancillary Services segment and the financial results and metrics attributable to its retail operations are included in our Direct-to-Consumer segment.
AMS
In April 2025, the Company continued the expansion of its footprint into the luxury precious metals market by acquiring the 90% of the outstanding equity interests of AMS it did not previously own. The Company had supplied bullion and related products to AMS for over ten years. The foundation of AMS brings together four decades of collector relationships with modern technology and compelling coin offerings that are sold through the GOVMINT brand. AMS has served over 500,000 customers in its history.
Monex
After decades of collaboration, in January 2026, we acquired Monex, one of the largest and most established direct-to-consumer precious metals dealers in the US. Monex was founded in 1987 and provides investors with access to gold, silver, platinum, and palladium through a full-service platform along with vault storage.
8
Secured Lending
The Company operates its Secured Lending segment through its wholly-owned subsidiary, Collateral Finance Corporation, LLC, including its wholly-owned subsidiary, CFC Alternative Investments (“CAI”) (collectively “CFC”). CFC has been operating since fiscal year 2005. CAI is a party to a joint venture known as Collectible Card Partners, LLC (“CCP”), which was formed for the purpose of making commercial loans collateralized by graded sports cards.
CFC is a California licensed finance lender that, directly and through its subsidiaries, originates and acquires commercial loans secured by bullion, numismatic coins, and graded sports cards. CFC's customers include coin and precious metal dealers, investors, and collectors. As of June 30, 2026, the aggregate balance of CFC's secured loans was approximately $115.1 million which is comprised of approximately 2% of loans acquired from third-parties and approximately 98% of loans originated by CFC.
CFC previously owned AM Capital Funding, LLC ("AMCF"), which was a special purpose entity whose sole activity consisted of operating, owning, and financing precious metal inventory through the issuance of notes (the “AMCF Notes”). In December 2023, the AMCF Notes were repaid and AMCF was dissolved in June 2024.
General. The secured loans that CFC issues consist of on-demand loans and loans with a term of three months to 364 days, with a typical term of approximately six months. Repayment of the loans can be made at any time without penalty. Because the loans are of relatively short duration, CFC does not have significant exposure to interest rate fluctuations, even in a rising interest rate environment. Loans carried by CFC range in size up to approximately $8.0 million.
All loans are fully secured by bullion, numismatic coins, graded sports cards, or other eligible alternative investment assets. TDS, on behalf of CFC, takes physical custody of the coins or bullion collateralizing the loans. CFC requires loan-to-value ("LTV") ratios of between 50% and 85%. LTV ratio refers to the principal amount of the loan divided by the liquidation value of the collateral, as conservatively estimated by CFC for numismatic loans and based on daily spot market prices for bullion loans. The LTV ratio varies with the nature of the collateral, with CFC allowing, for example, a higher LTV ratio for bullion than for rare coins. If, because of fluctuations in the market price of the pledged collateral, the LTV ratio on a loan increases above a prescribed maximum ratio, typically 85%, CFC can make a margin call on the loan. If the borrower does not meet the margin call, either by wiring payment or supplying additional collateral, CFC is authorized to sell the collateral, which it does through its affiliates. CFC has never experienced losses of principal on its loans.
Origination Activity. CFC's origination activities are complementary to the Company’s coin and bullion businesses and afford our customers a convenient means of financing their inventory or collections. CFC also attempts to leverage the worldwide storage capabilities of its TDS affiliate by offering clients TDS’s asset protection services in connection with the loans. CFC’s marketing efforts for its origination activity are conducted both in conjunction with the Company's trading operations, particularly with respect to dealers, and independently, including though its dedicated website www.cfcgoldloans.com. Interest rates on loans originated by CFC are determined based on current market conditions, borrower profile and type or mix of collateral. CFC also offers a variety of custom loan services to its origination clients, including renewal options, options to increase loan size, financing arrangements tailored to facilitate participation in numismatic auctions, and revolving loan arrangements. CFC services the loans that it originates.
Acquisition Activity. CFC also acquires portfolios of loans secured by bullion and numismatics coins from third-party originators. The loans acquired by CFC are sold subject to customary representations and warranties for loan portfolios of this type and must comply with CFC’s criteria for quality of collateral, LTV ratio, term and interest rate. Upon acquisition of a loan portfolio, CFC takes physical possession of the collateral securing the loans. In the event that a loan is non-performing, we will typically liquidate the collateral on behalf of the originator in order to retire the loan. Typically, loan portfolios acquired by CFC are serviced by the originator for a fee.
Financing Activity. CFC has historically financed its loan origination and acquisition activity primarily through the Company's demand line of credit with a syndicate of several financial institutions.
Liquidity
Our business depends substantially on our ability to obtain financing for our operations. Sources of cash generated from operating activities include receipts from the sales of precious metals, and cash collected from interest payments on secured loans.
Sources of cash provided by financing activities are our uncommitted line of credit, fixed interest rate notes, and other structured financing products. The Company’s line of credit and other financing products provides it with the liquidity to buy and sell billions of dollars of precious metals annually. As of June 30, 2026, our uncommitted line of credit provided access up to $427.5 million with a maturity date of September 2027.
The Company also generates funds from product financing arrangements with customers, whereby the Company sells its inventory with an option to repurchase, and through precious metal borrowing and leasing arrangements.
We periodically purchase our own common stock that is traded on public markets as part of our announced stock repurchase program. See more information regarding our share repurchase program in Part II, Item 5 of this Annual Report.
9
Market Making Activity
We act as a principal market maker, maintaining a two-way market for buying and selling precious metals. This means we both sell product to and purchase product from our customers.
Material Resources
We maintain a substantial inventory of bullion and coins in order to provide our customers with selection and prompt delivery. We acquire product for our inventory in the course of our trading activities with our customers, directly from government and private mints, mines, and refiners, and from commodities brokers and dealers, privately and in transactions on established commodity exchanges.
Our precious metals inventories are subject to market value changes created by change in the underlying commodity price, as well as supply and demand of the individual products the Company trades. Our inventory is marked-to-market daily for accounting and financial reporting purposes, except for our collectible coin inventory that is accounted for at lower of cost or net realizable value. Our policy is to remain substantially hedged as to our inventory position and its individual sale and purchase commitments. We seek to minimize the effect of price changes of the underlying commodity through the use of financial derivative instruments, such as forward and futures contracts.
Sales and Marketing
We market our products and services to our wholesale customers primarily through our offices in Costa Mesa, California, Hong Kong, and Singapore, our websites, and our dealer network, which we believe is the largest of its kind. Our dealer network consists of more than a thousand independent precious metal and coin companies, with whom we transact on a non-exclusive basis. The arrangements with the dealers vary, but generally the dealers acquire product from us for resale to their customers. In some instances, we deliver bullion to the dealers on a consignment basis. We also participate from time to time in trade shows and conventions, at which we promote our products and services. As a vertically integrated precious metals company, a key element of our marketing strategy is being able to cross-sell our products and services to customers within our various business units.
Our Direct-to-Consumer segment primarily markets its products over the internet through proprietary websites, using an internally developed search optimization strategy and paid placements with major search engines. Goldline reaches its retail customer base on television, radio, and the internet, as well as through customer service outreach.
We market our secured loan products and services to customers primarily through our proprietary websites, print advertising, and strategic partnerships.
Operational Support
The Wholesale Sales & Ancillary Services segment maintains administrative and operational support related to its trading, hedging, and finance product operations primarily at its offices in Costa Mesa, California, Hong Kong, and Singapore. We believe that our existing administrative and operational support infrastructure has the capacity to scale with our business activities. We store our inventories of bullion and numismatics at third-party depositories in major financial centers around the world and at our secured facilities in Las Vegas, Nevada and Dallas, Texas.
The Direct-to-Consumer segment maintains administrative and operational support at its offices in Dallas, Texas; Costa Mesa, Los Angeles, and Newport Beach, California; Eagan, Minnesota; Pinehurst, North Carolina; Calgary, Canada; and Singapore for originating and processing its retail operations. The Company's Trading, Finance, and Logistics business units provide supporting services such as hedging and order fulfillment.
The Secured Lending segment maintains administrative support at its headquarters in Costa Mesa, California for the processing of its originated loans, including billing, managing margin calls, and tracking of precious metal collateral. For the processing and administration of loans that are acquired from a third party (which may be a customer of the Company), customer invoices are typically processed by the originating dealer of the loan portfolio through a fee-based servicing arrangement. Collateral custody and security is managed by our Logistics business unit.
Customer Concentrations
For the year ended June 30, 2026, we had one customer that comprised more than 10% of our revenues. See Note 18 to the Company’s consolidated financial statements. The Company's largest customers generally are engaged with us in significant forward contract sales activity (as opposed to those customers with whom we principally have physical trading activity), which are entered into in order to hedge the Company's commodity holding risks, and not for speculative purposes.
10
Competition
Gold.com's activities cover a broad spectrum of the precious metals industry, with a concentration on the physical market. We service public, industrial, and private sector consumers of precious metals which include industrial manufacturers, refiners, minting facilities, banks, brokerage houses, and private investors. We frequently face different competitors in each area, and it is not uncommon for a customer and/or a supplier in one market segment to be a competitor in another.
Our Direct-to-Consumer segment competes with numerous online and other retailers of direct-to-consumer precious metal products. Competition is based primarily on price and customer service, including the ability to offer same day shipping. To a lesser extent, competition is also based on product availability, although all major ecommerce retailers will typically stock the products that are most in demand.
Our Secured Lending segment's market is believed to have limited direct competition. We believe factors, including access to capital, secure storage facilities, bullion and numismatic expertise, and other related services and offerings, provide us a competitive advantage in that marketplace.
Seasonality and Other Factors Influencing Demand
Our business is generally not seasonal, although demand in the retail market tends to be lower in the summer months. On the other hand, we believe our business is directly impacted by the perception of market trends and global economic activity. Historically, higher levels of demand for precious metals are brought on during periods of macroeconomic uncertainty, although conditions may fluctuate from period to period. Typically, factors that impact such uncertainty and correlate with a higher level of demand for precious metals include volatility in the equity markets, increases in rates of inflation, and the weakening of the U.S. dollar.
Compliance with Government Regulations
We are subject to a variety of domestic and foreign laws that relate particularly to our business. Because of the nature and value of the precious metal products in which we deal, we must be careful to assure compliance with the Foreign Corrupt Practices Act and a variety of anti-money laundering and know-your-customer rules in response to the USA Patriot Act, and similar foreign statutory regimes.
By reason of our direct-to-consumer business in particular, we collect personal data and are subject to European General Data Protection Regulation, the California Consumer Privacy Act and similar domestic and foreign statutes that address the collection, use and monitoring of such data. We continue to devote substantial resources to comply with these laws and regulations.
Our CFC financing subsidiary operates under a California Finance Lenders License issued by the California Department of Financial Protection and Innovation. CFC is required to submit a finance lender law annual report to the state which summarizes certain loan portfolio and financial information regarding CFC, which are subject to audit.
Human Capital
The efforts and expertise of our team members are critical to our success. We are devoted to the attraction, development, and retention of our employees, which enable us to deliver a high level of service to our customers. Because we have a small number of employees, and certain of our subsidiaries are geographically dispersed as a result of various acquisitions as well as from internal growth, our focus is on maintaining a relationship-based and collaborative work environment within each of our geographic locations. For the most part, our operating businesses are authorized to establish specific policies and practices concerning the attraction and retention of personnel in their organizations, addressing, among other things: maintaining a safe work environment for employees, customers and other business partners, offering competitive compensation and benefits to employees, and hiring practices intended to identify qualified candidates and promote diversity and inclusion in the workforce.
At the same time, we recognize the importance of “Tone at the Top”, and we have adopted company-wide corporate governance policies and procedures which emphasize accountability, transparency, fairness, and responsibility. Gold.com's senior management is responsible for establishing and monitoring our corporate governance practices, including monitoring governance efforts at each location, and participating in the resolution of governance-related issues as needed. Gold.com's Code of Business Conduct and Ethics emphasizes, among other things, the commitment to ethics and compliance with the law and provides basic standards for ethical and legal behavior of all its employees.
As of June 30, 2026, the Company had 1,355 employees, with 1,246 located in North America, 102 located in Asia, and 7 located in Europe; all except 52 of these employees were considered full-time employees. Our overall employee retention rate for the year ended June 30, 2026 was 84%; excluding our minting and refining and logistics operations, which hire largely in response to fluctuating business demands, our retention rate was 86%. For the companies we have owned for more than five years, the percentage of employees who have more than five years of service was 36%. For the companies we have owned and operated for less than five years, the percentage of employees who have continued their employment since the respective acquisition dates was 79%.
11
The Company is committed to supporting our employees’ financial, mental, and physical well-being. Across our various companies, we offer competitive pay and benefits, including annual short-term incentive awards and long-term equity awards, an employee savings 401(k) plan and company matching contributions, health insurance, disability insurance, life insurance, health savings and flexible spending accounts, wellness incentives, paid time off, family leave, parental leave, and employee assistance programs.
We provide equal employment opportunities to all qualified individuals without regard to race, color, religion, sex, gender identity, sexual orientation, pregnancy, age, national origin, physical or mental disability, military or veteran status, genetic information, or any other protected classification. Equal employment opportunity includes, but is not limited to, hiring, training, promotion, demotion, transfer, leaves of absence, and termination. The diversity of our workforce is essential, and we are committed to diversity and inclusion throughout the Company to ensure a wide range of experiences, perspectives, and skills to provide better solutions, drive innovation and creativity, and enhance decision making. As of June 30, 2026, approximately 35% of our employees identified as female, and 45% of our employees were made up of underrepresented minorities.
Corporate Information
Our executive offices are located at 1550 Scenic Ave, Suite 150, Costa Mesa, CA, 92626. Our telephone number is (844) 455-4653, and our website is www.gold.com. Through this website, we make available, free of charge, all of our filings with the Securities and Exchange Commission ("SEC"), including those under the Securities Exchange Act of 1934, as amended ("Exchange Act"). Such reports are made available on the same day that they are electronically filed with, or furnished to, the SEC. In addition, copies of our Code of Business Conduct and Ethics for Employees, Code of Business Conduct and Ethics for Senior Financial and Other Officers, and Code of Business Conduct and Ethics for Directors are available through our website, along with other information regarding our corporate governance policies.
Geographic Information
See Note 19 to the Company’s consolidated financial statements for information about the Company's geographic operations.
ITEM 1A. RISK FACTORS
Summary of Risk Factors
The following summary provides an overview of the material risks we are exposed to in the normal course of business. This risk factor summary does not contain all of the risk related information that may be important to you, and you should read these together with the more detailed discussion of risks set forth following this section, as well as elsewhere in this report under the heading “Management’s Discussion and Analysis of Financial Condition and Results of Operations.” Additional risks beyond those summarized below, or discussed elsewhere in “Risk Factors” and “Management’s Discussion and Analysis of Financial Condition and Results of Operations,” may apply to our activities or operations as currently conducted or as we may conduct them in the future, or to the markets in which we currently operate or may in the future operate.
12
13
Introductory Risks
The demand for our products and our profitability ultimately depend on preferences and perceptions regarding the desirability of owning precious metals, but those preferences and perceptions are subject to change.
While the Company operates at both the wholesale and direct-to-consumer levels, the demand for our products is dependent upon the perceptions and preferences in the global market regarding the ownership of precious metals and numismatics. These perceptions and preferences depend on a variety of factors, including world events (as discussed more fully below), business and economic conditions, inflationary and other currency related trends, the rise and attractiveness of cryptocurrencies and other digital assets and alternative investment opportunities. All such factors may change over time and as a consequence the results of our operations, profitability and stock price may vary over both the short and the long term.
We regularly seek to innovate and to anticipate market changes, but there is no assurance that we will be successful in doing so.
We are alert to the special sensitivity of our business to economic, social and political trends and events, and we attempt to project their effects on our business over the long term. For example, we have placed increasing emphasis on our direct-to-consumer business, in anticipation that economic uncertainties, market volatilities and global challenges continue to make investment in precious metals and numismatics more attractive to individual consumers. There can be no assurance, however, that we will be correct in our assessments of market trends or evolving business and consumer preferences, or that, even if our judgments are correct, our response to projected trends and preferences will be timely or effective. Moreover, because of the sensitivity of our business to macro-economic, social and political circumstances, there may be no effective strategy to insulate us from the adverse effects that these factors could have on our business.
Risks Relating to our Operations
Our business is heavily dependent on our ability to obtain financing.
Our business depends substantially on our ability to obtain financing for our operations. On December 21, 2021, we entered into a committed facility provided by a syndicate of financial institutions (the “Trading Credit Facility”), which, as of June 30, 2026, provided for a total revolving commitment of up to $427.5 million and a termination date of September 30, 2027. In 2026 we began leasing precious metals from Tether, a related party. While our liquidity in recent months has been provided primarily by precious metals leases, a majority of which are from Tether, prior to this, our liquidity was generally provided by our Trading Credit Facility. We use funds drawn under the Trading Credit Facility, through our precious metals leases, and through other financing products to purchase metals from our suppliers and for operating cash flow purposes. Our CFC subsidiary also uses these funds to finance certain of its lending activities.
If we are unable to access funds under precious metals leases, our Trading Credit Facility, or other financing products, we may be limited in the manner in which we conduct our business, and we may be unable to engage in favorable business activities or finance future operations or capital needs. We cannot assure you that our assets or cash flow would be sufficient to fully repay borrowings under our outstanding debt instruments, including the Trading Credit Facility and precious metals leases, upon acceleration or at maturity, or that we would be able to refinance or restructure the payments under these arrangements. Our failure to renew or replace these means of liquidity under such circumstances would reduce the financing available to us and could limit our ability to conduct our business, including certain lending activity of our CFC subsidiary. There can be no assurance that we could procure replacement financing on commercially acceptable terms on a timely basis, or at all. We have pledged a significant portion of our assets as collateral under the Trading Credit Facility, and if we were unable to repay the amounts outstanding thereunder, the administrative agent under the Trading Credit Facility could proceed against the collateral securing such indebtedness.
The Trading Credit Facility requires us to comply with customary affirmative and negative covenants, and with a variety of financial covenants, including a minimum working capital requirement; a fixed charge coverage ratio; a ratio of total recourse debt to consolidated tangible net worth; and limitations on the amount of ownership-based financings (as defined). Owing to the variability of our business, we may be required to request limited waivers of compliance with certain financial covenants under the Trading Credit Facility. There can be no assurance that such waivers will be granted. Upon the occurrence of an event of default under the Trading Credit Facility that was not cured or waived pursuant to the terms of the Trading Credit Facility, the lenders under the Trading Credit Facility could elect to declare all amounts outstanding under the Trading Credit Facility to be due and payable immediately.
We are subject to fluctuations in interest rates based on the variable interest terms of the Trading Credit Facility, and we may not be able to pass along to our customers and borrowers some or any part of an increase in the interest that we are required to pay under the Trading Credit Facility.
14
We could suffer losses with our financing operations.
We engage in a variety of financing activities with our customers:
Our ability to minimize losses on the credit that we extend to our customers depends on a variety of factors, including:
Liquidity constraints may limit our ability to grow our business.
We require adequate sources of liquidity to fund both our existing business and our strategy for expansion through organic growth and opportunistic acquisitions. Currently, our main sources of liquidity are the cash that we generate from operations, precious metals leases, and our Trading Credit Facility. There can be no assurance that our sources of liquidity will be adequate to support the growth that we are hoping to achieve or that additional sources of financing for this purpose, in the form of additional debt or equity financing, will be available to us, on satisfactory terms or at all. Also, the Trading Credit Facility contains, and any future debt financing is likely to contain, various financial and other restrictive covenants. The need to comply with these covenants may limit our ability to implement our growth initiatives.
The benefits we are currently experiencing from Tether's investment in the Company may not continue.
In February 2026, we entered into a transaction with TPM, S.A. de C.V., which, together with its affiliates, we refer to as Tether, whereby Tether purchased 3,371,000 shares of our common stock, or approximately 13.3% of our then outstanding shares, for $150.0 million. The purchase price for the shares represented an 11.9% discount to the 10-day volume weighted average price of our common stock on the New York Stock Exchange prior to the entry into the transaction. In connection with Tether’s investment in the Company, a designee of Tether was appointed to our board of directors.
The Company has entered into various commercial agreements with Tether whereby the Company leases precious metals from Tether, and Tether purchases and sells precious metals with the Company. Tether also utilizes the Company’s secure storage and logistics services. In addition, we purchased $20.0 million of XAU₮, a gold-backed stablecoin sponsored by Tether.
We intend to continue our strategic partnership with Tether with a view towards building a global integrated gold ecosystem, serving both retail and institutional customers across physical and digital markets. We believe that our efforts have been successful to date, particularly with regard to precious metals leasing, which has provided a significant source of our financing in recent periods.
However, in addition to the general risks associated with these transactions, including financing risks (see “Our business is heavily dependent on our ability to obtain financing” above); liquidity, market, and regulatory risks related to the ownership of digital assets; and commercial risks associated with our trading arrangements, there can be no assurance that any of the intended benefits of our business
15
relationship with Tether will be realized. We also can provide no assurance that our collaboration with Tether will not have adverse effects on the Company, for example on account of unfavorable perceptions among our customers of the crypto markets generally, or negative events that could in the future affect Tether in particular.
Loans under our credit facility may bear interest based on SOFR, but experience with SOFR based loans is limited.
Revolving loans under the Trading Credit Facility are at our option either Base Rate Loans that bear interest at a base rate plus a prescribed margin, or SOFR Loans that bear interest at rates selected by us based on the Secured Overnight Financing Rate published by the Federal Reserve Bank of New York (SOFR) plus prescribed margins. The use of SOFR based rates replaced rates based on the London interbank offered rate (LIBOR), and reflects the cessation of the publication of LIBOR rates by regulators in the United Kingdom and the discontinuation of the use of LIBOR in the financial markets. The use of SOFR based rates may result in interest rates and/or payments that are higher or lower than the rates and payments that we experienced under our prior Trading Credit Facility, where interest rates were based on LIBOR. Also, the use of SOFR based rates is relatively new, and there could be unanticipated difficulties or disruptions with the calculation and publication of SOFR based rates. In particular, if the agent under the Trading Credit Facility determines that SOFR Rates cannot be determined or the agent or the lenders determine that SOFR based rates do not adequately reflect the cost of funding the SOFR Loans, outstanding SOFR Loans will be converted into Base Rate Loans. This could result in increased borrowing costs for the Company.
We may experience supply chain disruptions in our operations.
As a result of various macro-economic factors, businesses in a variety of industries have experienced difficulty in obtaining the source materials required for their operations. We require coin and other bullion products, particularly products manufactured by government mints, for resale to our customers. We also require precious metals for the production of bullion bars, rounds and blanks by our Minting & Refining Division, consisting of our Silver Towne Mint and our recently acquired Sunshine Minting subsidiary. We have multiple sources for obtaining the bullion products which we resell to our customers, and our relationships with major refiners have to date provided us with an adequate source of material for our minting operations. We also maintain a supply of metal in case we experience a shortage of raw materials for our Minting & Refining Division. However, while we do not currently anticipate that our business will suffer as a consequence of problems in the national and global supply chains, we cannot assure you that this will continue to be the case. Our operations could be adversely impacted if we did not have an adequate source of supply for our Minting & Refining Division, particularly if we expand our minting operations to meet increased demand, or if supply chain disruptions significantly interfered with our sources of coin and bullion for resale. If significant supply chain constraints were to occur, we might be required to cut back on our minting operations or we might be unable to timely satisfy customer requirements for coin and bullion products. This could lead to a loss of sales and could adversely impact our reputation.
We are dependent on our key management personnel and our trading experts.
Our strategic vision and performance are dependent on Gregory Roberts, our Chief Executive Officer, other members of our senior management and certain other key employees. We have an employment agreement with Mr. Roberts which expires in June 2027. We also have employment agreements with Thor Gjerdrum, our President, and Brian Aquilino, our Chief Operating Officer, which expire in June 2028, and Robert Pacelli, Executive Vice President of Innovation and Strategic Initiatives and Chief Executive Officer and President of JMB, which expires in June 2029.
These and other employees have expertise in the trading markets, e-commerce operations and digital marketing; have industry-wide reputations; and perform critical functions for our business. We cannot offer assurance that we will be able to negotiate acceptable terms for the renewal of the employment agreements or otherwise retain our key employees. Also, there is significant competition for skilled precious metals traders and other industry professionals. The loss of our current key officers and employees, without the ability to replace them, would have a materially adverse effect on our business.
We rely extensively on computer systems to execute trades and process transactions, and we could suffer substantial economic injury if the operation of these systems were interrupted.
We rely on our computer and communications hardware and software systems to execute a large volume of trading transactions each year. Our dependence on computer and communications technology increased with the acquisition of JMB, whose sales are conducted primarily through the internet. It is therefore critical that we maintain uninterrupted operation of these systems, and we have invested considerable resources to protect our systems from physical compromise and security breaches and to maintain backups and redundancy. Nevertheless, our systems are subject to damage or interruption from power outages, computer and telecommunications failures, computer viruses, security breaches, including breaches of our transaction processing or other systems, catastrophic events such as fires, tornadoes and hurricanes, and usage errors by our employees. Breaches, damage or malfunctions affecting our systems may require significant investment for repair or replacement, and could interrupt our ability to provide quotations or trading services, or to conduct our e-commerce business.
16
We are also subject to ransomware attacks, in which malicious actors may seek to deprive us of access to our computer systems unless we pay substantial fees, and, if personal data were compromised, such attacks could result in costly investigation, litigation or regulatory fines.
We are incorporating artificial intelligence technologies into our processes and these technologies may present business, compliance, and reputational risks.
The Company is increasingly utilizing AI and generative artificial intelligence (“GAI”) technologies in certain of its processes, information systems and various operations, and expects that AI and GAI will assume a more critical role in its operations over time. The use of AI and GAI tools carries operational risk: outputs may be inaccurate, incomplete, or biased due to flawed algorithms, insufficient or erroneous training data, or other limitations, and reliance on such outputs in our business processes or decision-making could lead to errors, operational disruption, litigation, privacy risk, cybersecurity risks, and reputational harm, as well as fines and other penalties if such uses violate applicable laws and regulations, any of which adversely affect our business, financial condition and results of operations. Additionally, other unforeseen risks stemming from either the Company’s or third-party service providers’ use and development of AI tools and technologies, or the Company’s inability to adopt such technologies at the same pace as its competitors, may arise in the future that could adversely affect its business and results of operations.
The Company has minority investments in several entities engaged in precious metal marketing, but as a minority investor the Company is not able to exercise absolute control over these entities.
We hold minority interests in entities that are engaged in the business of precious metal and numismatic sales to consumers. Although by virtue of the Company’s investment in these entities, the Company is able to exert influence, and in some cases substantial influence, on the management of the entities, the Company does not have absolute control of these entities. As a consequence, circumstances may arise in which the management of these entities may take actions which we believe are not in our best interest and to which we object. The value of our investment in one or more of these entities may therefore decline. Also, because these investments are illiquid, we may not be able to dispose of our ownership interests in these entities should we choose to do so, at a price that we believe reflects its fair value or at all.
Risks Related to World Events
Our business is influenced by political conditions and world events.
The precious metals business is especially subject to global political conditions and world events. Precious metals are viewed by some as a secure financial investment in times of political upheaval or unrest, particularly in developing economies, which may drive up pricing. The volatility of the commodity prices for precious metals is also likely to increase in politically uncertain times. Conversely, during periods of relative international calm precious metal volatility is likely to decrease, along with demand, and the prices of precious metals may retreat. Because our business is dependent on the volatility and pricing of precious metals, we are likely to be influenced by world events more than businesses in other economic sectors.
In February 2026, the United States and Israel initiated air strikes against Iranian military objectives and leadership. Iran has retaliated with missile and drone strikes against United States and Israeli targets. It also launched numerous attacks on critical infrastructure in the region, including refining and power generation facilities. The conflict has substantially restricted shipping in the Strait of Hormuz, through which approximately 20% of the world’s supply of oil and other petroleum-based products ordinarily passes. These military actions follow prior conflicts involving Israel, the United States and Iran in the region, particularly as a consequence of the attack by Hamas on Israel in October 2023 and Israel’s response. In June 2026, the United States and Iran entered into a memorandum of understanding to end the hostilities and open the Strait of Hormuz to shipping, but it is unclear if negotiations and third-party mediation efforts will result in a permanent cessation of hostilities and freedom of shipping in the Strait.
It is not possible to predict the broader consequences of this conflict, which could materially adversely affect global trade, supply chains, transportation costs, currency exchange rates, regional economies and the global economy, and its impact on us. We could benefit from the resulting uncertainty and instability, as it may encourage investors to seek perceived safety in the ownership of precious metals. On the other hand, investors could turn to other financial assets, which may account for the double-digit percentage decline in the prices of gold and silver in the period following the onset of the conflict with Iran.
The Company has no operations in the Middle East at the current time. However, events there could adversely affect the business that we conduct with customers in the Middle East. It may also adversely affect our business in other parts of the world. In particular, worldwide escalation of energy costs and potential shortages as a consequence of the military action in the Middle East could have a depressing effect on the global economy that may reduce the demand for our precious metal products.
17
Russia is continuing to engage in its military action against Ukraine. In response, the United States and certain other countries imposed significant sanctions and export controls, and could impose further sanctions and controls, against Russia, Belarus and certain individuals and entities connected to Russian or Belarusian political, business, and financial organizations. The conflict has also created uncertainty regarding, and potential shortages of, grain and fossil fuel supplies in Europe and elsewhere. We have a marketing support operation in Austria and have significant business in Germany and other parts of Europe that could be materially and adversely affected by the continuing or expanded military activity in that region.
The Company’s acquisition of the precious metals business of LPM in Hong Kong, its recently acquired joint venture of a minting facility in Shanghai, China, and its strategy to expand its presence in the Far East may be adversely affected by escalating diplomatic tensions between the United States and the People's Republic of China. Future sanctions, export controls, outbound investment restrictions and other regulatory measures adopted by the United States, China or other jurisdictions may adversely affect the Company's operations, counterparties, sourcing activities or expansion plans in the region. Also, the conflicting claims and military presence of the People's Republic of China and other countries, including the United States, in the South China Sea may have negative repercussions both for the Company’s operations in the Far East region as well as the precious metals markets more broadly.
The Company experienced outsized growth in its revenues and operating profits during periods of volatility in the financial markets in recent years, and there can be no assurance that this level of performance will be attainable in the future.
The substantial growth of the business of the Company in recent years may be attributed, in part, to a high degree of volatility in the financial markets, resulting from various geopolitical, macroeconomic, military and global uncertainties and events. In this environment, consumers may have sought perceived financial safety in precious coins and metals. Our stock price responded favorably to these circumstances as well.
Our profits have since retreated from their all-time highs experienced during these times, and there can be no assurance that this historically unprecedented performance of the precious metals business will be attainable in future periods. Our business in the past has been subject to fluctuations, and we are beginning to experience to a degree a return to cyclicality in our more recent operating results. Consumer perceptions with respect to precious coins and metals could shift, and these commodities may no longer be viewed as secure investments. Slower precious metals markets with lower volatility and greater supply, as we have experienced more recently, have had and could continue to have the effect of decreasing the volume of products sold and also adversely impacting our product premiums, which are a key driver of our overall performance. A sustained decline in our revenues and earnings would have adverse effects on our operations and would likely cause our stock price to decline. It is not possible to predict with any accuracy future market trends, and in particular whether the extremely favorable environment for our business during volatile financial markets will return. As a result, we cannot tell when, if at all, our profitability will once more achieve the unprecedented levels that we experienced during recent periods. Moreover, because of the nature of the current business and financial environment, particularly concerning the precious metal industry, it is difficult to create with any acceptable measure of precision customary financial projections and forecasts for our business over the next several years. This could adversely affect our ability to engage in financial and operational planning for the future.
We derive significant revenues from business outside the United States.
We derive a significant portion of our revenues from business outside the United States, including from customers in developing countries. Business operations outside the U.S. are subject to political, economic and other risks inherent in operating in foreign countries. These include risks of general applicability, such as the need to comply with multiple regulatory regimes; trade protection measures and import or export licensing requirements and tariffs; and fluctuations in equity, revenues and profits due to changes in foreign currency exchange rates. Currently, we do not conduct substantial business with customers in developing countries. However, if our business in these areas of the world were to increase, we would also face risks that are particular to developing countries, including the difficulty of enforcing agreements, collecting receivables, protecting inventory and other assets through foreign legal systems, limitations on the repatriation of earnings, currency devaluation and manipulation of exchange rates, and high levels of inflation.
We try to manage risks of doing business in foreign jurisdictions by monitoring current and anticipated political, economic, legal and regulatory developments in the countries outside the United States in which we operate or have customers and adjusting operations as appropriate, but there can be no assurance that the measures we adopt will be successful in protecting the Company’s business interests.
The Company’s acquisition of LPM, a precious metals business located in Hong Kong, reflects the Company’s efforts to increase its presence in Asia, particularly the Far East. There can be no assurance that the Company’s expansion efforts in the Far East will be successful. Moreover, there are particular regulatory, as well as other, challenges to conducting business in the People's Republic of China, and as a result certain foreign businesses have recently been decreasing their presence there. The Company may encounter similar challenges, which may impede the Company’s expansion efforts in the region.
18
Recently announced changes to U.S. trade policy, including recently announced tariffs, and planned additional tariffs, could adversely affect our business.
In the first half of 2025, President Trump imposed a range of tariffs pursuant to the International Emergency Economic Powers Act, or IEEPA. On February 20, 2026, the U.S. Supreme Court held in Learning Resources, Inc. v. Trump (Feb. 20, 2026), that IEEPA does not authorize the President to impose tariffs. Following the Supreme Court’s decision, the Trump Administration announced its intention to replace the invalidated tariffs with new tariffs under different statutory authorities, including, but not limited to, Section 122 of the Trade Act of 1974, Section 232 of the Trade Expansion Act of 1962 and Section 301 of the Trade Act of 1974. On February 20, 2026, President Trump issued Proclamation 11012, imposing, for a period of 150 days, a temporary 10% ad valorem tariff on articles imported into the United States under Section 122, effective February 24, 2026. There are currently trade investigations pursuant to Section 232 and Section 301 that may apply to some of our products.
We have customers in various foreign jurisdictions. We are also an authorized distributor of gold and silver coins from all major sovereign mints, including the Australian (Perth) Mint, the Austrian Mint, the Royal Canadian Mint, the China Mint, Banco de Mexico, the South African Mint (Rand Refinery) and the Royal Mint (United Kingdom). If retaliatory tariffs or other trade restrictions are imposed by foreign jurisdictions, or if trade disputes otherwise reduce market access or increase delivered prices, demand for our bullion and numismatic products in those jurisdictions may decline. Increased trade regulation may also adversely affect inflation, interest rates, logistics costs, consumer discretionary spending and our strategy for international growth.
The effect of these developments on us is uncertain. The demand for precious metals and numismatics has often increased in times of economic, financial and political uncertainty, and trade-related volatility may increase customer demand for certain of our products. At the same time, changes in tariff rates, the scope of exemptions, customs classifications, de minimis treatment, country-of-origin determinations and other trade rules may increase our product costs, disrupt supply chains, delay or limit product availability, increase our compliance costs, and reduce our margins if we are unable to pass increased costs on to customers.
We are monitoring and evaluating the potential impact that existing tariffs under Section 122, changing tariff exemptions, and ongoing Section 232 and Section 301 investigations may have on our business and are considering ways to mitigate those impacts. There can be no assurance, however, that we will be successful in doing so, or that future U.S. or foreign trade measures will not have a material adverse effect on our business.
Inflation and high interest rates may adversely affect our costs and expenses and the demand for our products.
The United States and other world economies are currently experiencing a significant uptick in the level of inflation. Interest rates, while they have recently come down, remain high in comparison to rates in the period 2010 to 2022. Certain investors, including customers of our Direct-to-Consumer segment, may regard precious metal products as a hedge against inflation and high interest rates, which could positively affect demand for our goods and services. However, inflation may also increase our operational expenses, which because of the nature of our business we cannot generally pass along to our customers. Our Trading Credit Facility bears interest at a variable rate of interest, so that higher interest rates would also increase our cost of borrowing under that facility, and higher interest rates may also increase the costs under our product financing arrangements. We may be unable to compensate for these increases through higher interest income and other fees and charges received from our counterparties. Also, inflation, together with high interest rates, may reduce discretionary spending among consumers, thereby reducing product demand in the retail sector.
Risks Related to our Wholesale Sales & Ancillary Services Segment
The loss of a government purchaser/distributorship arrangement could materially adversely affect our business.
Gold.com’s business is heavily dependent on its purchaser/distributorship arrangements with various governmental mints. Our ability to offer numismatic coins and bars to our customers on a competitive basis is based on the ability to purchase products directly from a government source. The arrangements with the governmental mints may be discontinued by them at any time. The loss of an authorized purchaser/distributor relationship, including with the U.S. Mint, could have a material adverse effect on our business.
We operate in a highly competitive industry.
The business of buying and selling precious metals is global and highly competitive. The Company competes with precious metals firms and banks throughout North America, Europe and elsewhere in the world, some of whom have greater financial and other resources, and greater name recognition, than the Company. We believe that, as a full-service firm devoted exclusively to precious metals trading and marketing, we offer pricing, product availability, execution, financing alternatives and storage options that are attractive to our customers and allow us to compete effectively. We also believe that our purchaser/distributorship arrangements with various governmental mints give us a competitive advantage in our coin distribution business. However, given the global reach of the precious metals business, the absence of intellectual property protections, and the availability of numerous, evolving platforms for trading in precious metals, we cannot assure you that the Company will be able to continue to compete successfully or that future developments in the industry will not create additional competitive challenges.
19
The Company is subject to risks relating to the operations of its Minting & Refining Division.
Our Minting & Refining Division, which operates our Silver Towne Mint and our Sunshine Minting subsidiaries, depends on critical pieces of equipment which may be out of service occasionally for scheduled upgrades or maintenance or as a result of unanticipated failures or business interruptions. The facilities of our Minting & Refining Division are subject to equipment failures and the risk of catastrophic loss due to unanticipated events such as fires, earthquakes, accidents, or violent weather conditions. We have insurance to cover certain of the risks associated with equipment damage and resulting business interruption, but there are certain events that would not be covered by insurance, and there can be no assurance that insurance will continue to be available on acceptable terms. One such casualty event occurred in recent years as a result of a tornado, which although covered by insurance, temporarily interrupted operations at Silver Towne Mint.
The ability of our Minting & Refining Division to continue to expand the scope of its services and customer base depends in part on its ability to increase the size of its skilled labor force. Historically, the demand for skilled personnel has been high and the supply limited. The inability to employ or retain skilled technical personnel could constrain the operations of our Minting & Refining Division and its growth opportunities.
Our business may at times be dependent on a concentrated customer base.
One of the Company's key assets is the customer base of its Wholesale Sales & Ancillary Services segment. This customer base provides deep distribution of product and makes the Company a desirable trading partner for precious metals product manufacturers, including sovereign mints seeking to distribute precious metals coinage or large refiners seeking to sell large volumes of physical precious metals. In any given quarter, our sales in this segment may be derived from a small number of significant customers. If our relationships with these customers deteriorated, or if we were to lose these customers, our business could be materially adversely affected.
The materials that we hold are subject to loss, damage, theft or restriction on access.
We have significant quantities of high-value precious metals at our logistics facilities, at third-party depositories and in transit. There is a risk that gold and other precious metals that we hold, whether on our own behalf or on behalf of our customers, could be lost, damaged, or stolen. In addition, access to our precious metals could be restricted by natural events (such as an earthquake) or human actions (such as a terrorist attack). Although we maintain insurance on terms and conditions that we consider appropriate, we may not have adequate sources of recovery if our precious metals inventory is lost, damaged, stolen or destroyed, and recovery may be limited. Among other things, our insurance policies exclude coverage in the event of loss as a result of terrorist attacks or civil unrest.
Our logistics depository is subject to authorization by our lenders.
Our lenders under our Trading Credit Facility have approved our logistics facilities as an authorized depository. If that approval were to be withdrawn for any reason, we would no longer be able to keep inventory at that location, which would substantially limit our ability to conduct business from that facility.
Risks Related to our Direct-to-Consumer Segment
Our Direct-to-Consumer businesses could be subject to accusations of improper sales practices.
Our Direct-to-Consumer segment consists of subsidiaries JM Bullion, Inc. (“JMB”), Goldline, Inc., Pinehurst Coin Exchange, Inc., Spectrum Group International LLC (“SGI”), AMS Holding, LLC (“AMS”), AM LPM Singapore PTE Ltd. and Monex Deposit Company (including certain related entities, “Monex”) and our controlling interest in Silver Gold Bull, Inc. (“SGB”). Through our Direct-to-Consumer segment, the Company sells precious metals and numismatics directly to the retail investor community. JMB, SGB and Pinehurst market their products primarily over the internet. Goldline markets its precious metal products on television, radio, and over the internet, and through customer service outreach. SGI conducts its retail business through auctions of numismatic and bullion products and its retail store locations. AMS markets its products over the internet, and also has sales representatives who work closely with customers to enhance their purchase experience. LPM’s retail business, AM LPM Singapore PTE Ltd., is conducted over the internet and its numismatic showroom in Hong Kong. Monex sells its products through sales representatives and long-standing investor relationships.
20
Prior to its acquisition by the Company, Goldline had been accused of improper sales practices, and was the subject of a state enforcement action that was subsequently settled. Other retailers of precious metal products have similarly been the subject of accusations regarding their sales practices, including claims of misrepresentation, excessive product markups, pressured sales tactics and product switching. The Company believes that the sales practices of its Goldline subsidiary conform to applicable legal and ethical standards, and that there was no material basis for claims against Goldline in this regard. Nevertheless, given the nature of the retail precious metals business, the possibility that investors in precious metals may lose a substantial portion of their investment as a result of adverse market trends and the vulnerability of certain retail precious metal investors to economic loss, there can be no assurance that claims will not be made regarding business practices of our Direct-to-Consumer businesses or that, if made, such claims will not attract the attention of governmental and private sector consumer advocates. Were this to occur, the Company could suffer adverse publicity, be subject to governmental enforcement actions or be forced to modify the sales and marketing practices of its Direct-to-Consumer business.
Our Direct-to-Consumer businesses operate in a highly competitive environment.
Our Direct-to-Consumer businesses face competition from other specialty online precious metal and coin sites, as well as from traditional precious metal retail brokers and coin stores. In addition, certain general online merchandisers such as eBay also offer collectible coins and bullion for sale, and other major online retailers, with financial and marketing resources, name recognition and a customer base that are far greater than those that are available to us, may in the future enter this market. Competition is based upon the availability of coin and bullion product, price, delivery times, convenience and customer service. There can be no assurance that we will be able to compete effectively with other retail sources and channels for precious coin and bullion, especially if the demand for these products were to contract.
JMB’s search engine optimization strategies have provided it with an important competitive advantage, but this may not continue.
We believe that the internally developed search engine optimization (SEO) strategies of JMB provide its business with a competitive advantage in driving traffic to its sites over other e-commerce precious metal retailers and have been a significant factor in the growth of JMB. The challenges of efficient SEO programming are continually evolving, and other e-commerce retailers in the precious metal space are constantly working to improve their own SEO capabilities. If JMB does not continue to maintain its competitive edge in SEO technology, it could lose customers and market share to its competitors.
Many of our Direct-to-Consumer businesses rely upon paid and unpaid internet search engines to rank their product offerings and drive traffic to their websites, and their website traffic may suffer if their rankings decline or their relationships with these services deteriorate.
Many of our Direct-to-Consumer businesses rely on paid and unpaid internet search engines to attract consumer interest in their product offerings. Search engine companies change their algorithms periodically, and these changes may adversely affect the display of our product offerings in paid and/or unpaid searches. JMB and SGB may also at times be subject to ranking penalties if the operators of search engines believe either is not in compliance with their guidelines. If our Direct-to-Consumer's search engine rankings decline, and we are unable to timely regain our prior rankings, we may have to use more expensive marketing channels to sustain and grow our Direct-to-Consumer revenues, resulting in reduced profitability.
If our Direct-to-Consumer businesses do not respond effectively to technological and market changes, they will cease to be competitive with other channels that consumers may have for the purchase of precious coins and bullion.
To remain competitive, our Direct-to-Consumer businesses must continue to enhance and improve the responsiveness, functionality and features of their online operations. The internet and the e-commerce industry are characterized by rapid technological change, changes in user and customer requirements and preferences, frequent new product and service introductions embodying new technologies, and the emergence of new industry standards and practices.
The evolving nature of the internet could render our Direct-to-Consumer segment's existing technology and systems obsolete. Its continuing success will depend, in part, on its ability to:
21
With the growth of e-commerce, the pace of change in product offerings and consumer tastes is faster now than in years past. This accelerated pace of change increases uncertainty and places a greater burden on management to anticipate and respond to such changes. The increased pace of change also means that the window in which a technologically advanced or sophisticated product or service can achieve and maintain partner and consumer interest is shrinking and, to the extent our Direct-to-Consumer segment fails to timely anticipate or respond to changes in its industry, the effects of missteps may be amplified.
Future advances in technology may not be beneficial to, or compatible with, our Direct-to-Consumer businesses. Furthermore, our Direct-to-Consumer businesses may be unsuccessful in using new technologies effectively or adapting their technology and systems to user requirements or emerging industry standards on a timely basis. Their ability to remain technologically competitive may require substantial expenditures and lead time. If we are unable to adapt in a timely manner and at reasonable cost to changing market conditions or user requirements, our Direct-to-Consumer businesses will cease to be competitive with other channels for the purchase of precious coins and bullion.
If JMB fails to continuously improve its websites on all relevant platforms, including mobile, it may not attract or retain customers.
JMB owns and operates numerous websites targeting specific niches within the precious metals retail market, including JMBullion.com, ProvidentMetals.com, Silver.com, CyberMetals.com, GoldPrice.org, SilverPrice.org, BGASC.com, and BullionMax.com. JMB must continually update its websites on all relevant platforms, including mobile, to improve and enhance its content, accessibility, convenience and ease of use. Failure to do so may create a perception that the websites of JMB’s competitors are easier to use and navigate or that they are better able to service customer needs for precious metal coins and bullion. If such a perception were to gain traction, traffic to JMB’s websites and its revenues would suffer.
Certain of JMB’s websites publish data concerning the precious metal and cryptocurrency markets obtained from third parties, which could be inaccurate.
JMB’s GoldPrice.org and SilverPrice.org publish data on precious metal and cryptocurrency pricing which is obtained from third parties. While we believe that the sources of the published data are reliable, the data is not independently verified by JMB or us. If the data that JMB receives and publishes were inaccurate, and were relied upon by consumers visiting these websites, JMB could be exposed to liability and may suffer damage to its reputation. To mitigate this risk, the Terms and Conditions for these websites include investment risk disclaimers, although there can be no assurance that these disclaimers will provide the intended protection.
JMB, Goldline, SGB, Monex, and SGI expect to profit on precious metals acquired from their customers, but that might not be the case.
Through its Direct-to-Consumer Purchase Program, JMB offers to purchase precious coins and bullion owned by its customers. Through Precious Metals Purchasing Partners, LLC (“PMPP”), a joint venture between Goldline and SGB, Goldline, SGB and Monex engage in similar repurchases. SGI's subsidiary Stack’s Bowers Galleries also purchases rare coins and currency from the public at its retail store locations. We believe that these programs encourage the purchase of coins and bullion as an investment because it assures customers that their investment in the products offered by JMB, Goldline, SGB, Monex and SGI will be liquid and can be monetized if the customers have a need for cash. JMB, Goldline, SGB, Monex and SGI offer to purchase coins and bullion from their customers at prices designed to reflect current market valuations, but also allow them to profit on the resale of the products. There can be no assurance, however, that JMB, Goldline, SGB, SGI, or Monex will in fact be able to resell product that they purchase at a price that will justify the cost of purchase. In a declining market for precious metal products, JMB, Goldline, SGB, Monex and SGI could be burdened with substantial amounts of purchased inventory that they are unable to resell at an economic price, or at all. However, the suspension or discontinuance of the customer repurchase programs because of adverse market conditions could impair the perception among customers that precious coin and bullion is a safe and attractive investment.
22
The business of Stack’s Bowers Galleries may subject us to auction-related risks.
Stack’s Bowers Galleries, which we purchased through our acquisition of its parent company SGI, is one of the leading houses for the conduct of both live and online precious metals auctions. The success of its auction business depends in substantial part on the consignment for auction of premier numismatic collections. Some of the largest collections of this sort have in recent years been auctioned by Stack’s Bowers Galleries, but there can be no assurance that the Company will be successful in identifying and obtaining the rights to auction of similar collections in the future. Stack’s Bowers Galleries is dependent on its numismatic experts for the authentication, valuation and cataloging of the products that it sells at auction, but these experts are in high demand, and there is no guaranty that the Company can retain the services of these experts or engage others with similar levels of expertise. Stack’s Bowers Galleries has diligence procedures for the purpose of vetting both sellers and buyers at its auctions, as a consequence of which the Company is reasonably confident that the participants in its auctions are not on a restricted list and are not otherwise engaged in illegal activity. These procedures are particularly intended to assure that the buyers at auction have the financial resources to pay for items on which they have successfully bid. There can be no assurance, however, that the procedures will identify and exclude all bad actors from Stack’s Bowers Galleries auctions or that bidders at the auctions will in each case pay the hammer price on the items for which they have bid. Also, in some cases, Stack’s Bowers Galleries itself participates as a bidder in the auctions that it conducts, which can create a perception of unfairness. If the reliability and integrity of the auctions conducted by Stack’s Bowers Galleries were to be challenged, for these or any other reasons, the reputation of Stack’s Bowers Galleries may suffer, with a consequence that it may no longer be successful in attracting quality sellers and buyers to its auctions.
Risks Related to our Secured Lending Segment
Our lending business depends on the ability of CFC to originate or acquire loans secured principally by bullion and numismatic coins.
The performance of our Secured Lending segment depends on having a portfolio of loans of sufficient size and quality to justify the expenses and allocation of financial resources committed to the Company’s loan business. CFC both originates loans to customers of our wholesale and trading business and also acquires portfolios of loans originated by other parties. The Company typically stores the bullion and numismatics that serve as collateral for the loans. As CFC does not independently market its lending business, it is dependent on the interest of the customers of the Company’s wholesale and trading business in financing their acquisition of bullion and numismatics with loans made by CFC. The interest of the Company’s customers in obtaining loans from CFC is dependent on numerous factors, including the availability of other sources of financing, the interest rate environment, other alternatives for the storage of their bullion and numismatics, their business relationship with the Company and the level and types of businesses conducted by the Company’s Wholesale Sales & Ancillary Services segment. The Secured Lending segment is also dependent on CFC’s ability to identify and acquire portfolios of loans secured by bullion and numismatics originated by third parties satisfying the Company’s standard for quality and risk. There can be no assurance that CFC will be successful in continuing to originate and acquire secured loans in amounts sufficient to justify the conduct of this business.
The number of loans and the size of CFC’s loan portfolio can vary significantly from period to period.
CFC’s loan portfolio can vary considerably from period to period, both as to the number of loans in the portfolio and the total size of the portfolio in terms of dollar amount. The variation of CFC's loan portfolio is attributable to a variety of factors, including the success of the Company in originating and acquiring loans discussed above, as well as the maturities of the loans in the portfolio and the decisions of borrowers to prepay or extend the terms of their loans. As a consequence, the performance of the Secured Lending segment in a particular financial reporting period may not be indicative of how the segment will perform in any future period, either in the short or the long term.
The growth of the Secured Lending segment is likely to require significant resources.
Historically, the Company has originated loans almost exclusively to customers of its wholesale and trading business. The opportunity to finance purchases of bullion and numismatics with secured loans obtained from CFC is part of a suite of ancillary services that the Company provides to its customers. The business of the Secured Lending segment, with respect to both the origination and acquisition of loan portfolios, is constrained by the Company’s borrowing capacity under its Trading Credit Facility, on which it relies to finance the much larger business of the Wholesale Sales & Ancillary Services segment. Any significant future growth of the Secured Lending segment will require the application of significant additional resources to this business, and there can be no assurance that such resources will be available or that the Company will not determine that such resources, even if available, should be applied to other areas of the Company’s business.
23
Risks Relating to Commodities
Gold.com’s business is heavily influenced by volatility in commodities prices.
A primary driver of the Company’s profitability is volatility in commodities prices, which leads to wider bid and ask spreads. Among the factors that can impact the price of precious metals are supply and demand of precious metals; political, economic, and global financial events; movement of the U.S. dollar versus other currencies; and the activity of large speculators such as hedge funds. If commodity prices were to stagnate, there would likely be a reduction in trading activity, resulting in less demand for the services the Company provides, and spreads would likely decrease, which could materially adversely affect our profitability.
The period-to-period changes in volatility may cause our revenues to fluctuate, as a consequence of which our results for any one period may not be indicative of the results to be expected for any future period. See “Management’s Discussion and Analysis of Financial Condition and Results of Operations.”
Our business is exposed to the risk of changes in commodity prices, and our hedging activity to protect our inventory is subject to risks of default by our counterparties.
The Company's precious metals inventory is subject to market value changes created by changes in the underlying commodity prices, as well as supply and demand of the individual products the Company trades. In addition, open sale and purchase commitments are subject to changes in value between the date the purchase or sale is fixed (the trade date) and the date metal is delivered or received (the settlement date). We seek to minimize the effect of price changes of the underlying commodity through the use of financial derivative instruments, such as forward and futures contracts. The Company's policy is to remain substantially hedged as to its inventory position and its individual sale and purchase commitments. The Company’s management monitors its hedged exposure daily. However, there can be no assurance that these hedging activities will be adequate to protect the Company against commodity price risks associated with our business activities.
Furthermore, even if we are fully hedged as to any given position, there is the risk of default by our counterparties to the financial instruments that we use to hedge our inventory. A default by a counterparty on a substantial hedge could have a material adverse effect on our business.
Increased commodity pricing could limit the inventory that we are able to carry.
We maintain a large and varied inventory of precious metal products, including bullion and coins, in order to support our trading and Direct-to-Consumer activities and provide our customers with superior service. The amount of inventory that we are able to carry is constrained by the borrowing limitations and working capital covenants under the Trading Credit Facility. If commodity prices were to rise substantially, and we were unable to modify the terms of the Trading Credit Facility to compensate for the increase, the quantity of product that we could finance, and hence maintain in our inventory, would fall. This would likely have a material adverse effect on our operations.
We rely on the efficient functioning of commodity exchanges around the world, and disruptions on these exchanges could adversely affect our business.
The Company buys and sells precious metals contracts on commodity exchanges around the world, both in support of its customer operations and to hedge its inventory and transactional exposure against fluctuations in commodity prices. The Company’s ability to engage in these activities would be compromised if the exchanges on which the Company trades or any of their clearinghouses were to discontinue operations or to experience disruptions in trading, due to computer problems, unsettled markets, sanctions against commodity exporting countries or other factors. For example, if there were to be disruptions in the supply chain for gold, silver, platinum or palladium, our ability to buy and sell these metals on the commodity exchanges would be materially and adversely affected.
The Company may also experience disruption and risk of loss if futures commission merchants or commodity brokers with whom we deal were to become insolvent or bankrupt.
Our business is subject to the risk of fraud and counterfeiting.
The precious metals (particularly bullion) business is exposed to the risk of loss as a result of “materials fraud” in its various forms. We seek to minimize our exposure to this type of fraud through a number of means, including third-party authentication and verification, reliance on our internal experts and the establishment of procedures designed to detect fraud. However, there can be no assurance that we will be successful in preventing or identifying this type of fraud, or in obtaining redress in the event such fraud is detected.
24
Risk Related to our Regulatory Environment
The CFTC may seek to assert jurisdiction over the Company’s activities.
The Company believes that its Direct-to-Consumer operations are generally conducted in a manner that does not implicate the jurisdiction of the Commodity Futures Trading Commission ("CFTC"), as it does not sell products to retail customers for future delivery. The Commodity Exchange Act (the “CEA”) and the rules and regulations of the CFTC are drafted broadly, however, and practices that the Company does not regard as futures transactions may be regarded as such by the CFTC.
During the first quarter of fiscal 2023, the Company and Goldline settled an action in which the CFTC alleged, among other things, that certain financing arrangements that were made available to customers constituted off-exchange retail commodity transactions. Although this matter was settled on terms satisfactory to the Company with no material financial impact, and Goldline has discontinued these particular arrangements and practices, there can be no assurance that the CFTC will not in the future allege we are violating the CEA or the rules and regulations of the CFTC, or otherwise (along with other federal or state agencies) seek to oversee aspects of our operations which could adversely affect us.
Legislative and regulatory initiatives will require us to expend time and resources on environmental reporting.
Although our manufacturing activity is limited to the production of bullion products in our Minting & Refining Division, recent California legislation will require us to make disclosures regarding environmental matters that could entail significant time and expense. We also may be subject to data gathering requirements of the European Union relating to environmental matters.
On October 7, 2023, California Governor Gavin Newsom signed into law Senate Bill ("SB") 261, Greenhouse Gases: Climate-Related Financial Risk, and SB 253, the Climate Corporate Data Accountability Act, which significantly expand climate-related disclosure requirements for companies doing business in California. As a company with operations in California, we may fall under the jurisdiction of these new laws, which impose rigorous reporting obligations regarding our climate-related financial risks and extensive requirements for the disclosure of greenhouse gas emissions.
SB 253 imposes its greenhouse gas reporting obligations on companies doing business in California with annual revenues exceeding $1.0 billion. Given our revenue levels and California operations, we are subject to the requirements of SB 253. SB 253 requires the reporting of Scope 1 greenhouse gas emissions (direct emissions from our operations) and Scope 2 greenhouse gas emissions (indirect emissions from our operations) for the prior fiscal year beginning in 2026. SB 253 requires reporting of Scope 3 greenhouse gas emissions (emission from third parties in our value chain) for the prior fiscal year beginning in 2027. According to rules adopted by the California Air Resources Board on February 26, 2026, we are required to report Scope 1 emissions from any entity that we own or control and Scope 2 emissions regardless of location by August 10, 2026. Non-compliance with these reporting requirements could expose us to administrative penalties of up to $500,000 per reporting year.
Commencing on January 1, 2026, and biennially thereafter, SB 261 mandates that we publicly disclose our climate-related financial risks, which may include risks to our own operations, the operations of our suppliers and customers and the precious metals markets generally. This includes detailing the strategies we have adopted to mitigate and adapt to these risks. Our compliance reports must be made publicly available on our company's website. Non-compliance with the requirements of SB 261 could expose us to a fine of up to $50,000 per reporting year and we may also be required to pay an annual filing fee. The California climate disclosure is the subject of ongoing litigation that could impact whether and when the Company is required to make the disclosures required by the regime. The Company will monitor that litigation as it prepares to comply with the rule.
On March 6, 2024, the Securities and Exchange Commission (“SEC”) issued final rules requiring public companies to disclose both greenhouse gas emissions and climate risk. The SEC rules overlap significantly with both the California reporting regime discussed above and the European Corporate Sustainability Directive discussed below, although there are material differences. The SEC rules have been the subject of litigation. As a consequence, in April 2024 the SEC suspended the effectiveness of the rules, and in March 2025 the SEC stated that it would no longer defend the rules in the litigation, which is currently in abeyance. On May 26, 2026, the SEC issued a proposed rule rescinding the 2024 environmental disclosure rules. The Company intends to monitor the litigation and SEC rulemaking.
25
The European Union adopted new data gathering, policy implementation and disclosure standards and rules related to environmental, social, and corporate governance ("ESG") matters in the Corporate Sustainability Reporting Directive (“CSRD”), which became effective in 2023, and the Corporate Sustainability Due Diligence Directive (“CSDDD”), which became effective in 2024. Both apply to both EU and non-EU entities. The EU modified these requirements in the so-called “Omnibus” Directive published in February 2026, which made changes to both the CSRD and CSDDD. Because our operations in Europe surpass the net turnover threshold in the rule and we may be deemed to have an EU branch or subsidiary, we may be subject to CSRD and CSDDD data gathering, policy development and reporting requirements. We will know more about the specific disclosure requirements when the EU adopts implementing regulations for the non-EU groups that are covered by the rule, but because of the broad scope of the requirements of these rules, ranging from environmental matters to human rights, and because of the extensive data gathering and policy implementation requirements related to not only our operations but those of our suppliers and customers, compliance with these obligations could result in significant cost and require significant management time.
These changing rules and regulations, and the stakeholder expectations related to ESG described in "Risk Factors of General Applicability – Third-party expectations relating to ESG factors may impose additional costs and expose us to new risks," have resulted in and are likely to continue to result in increased general and administrative expenses and increased management time and attention spent complying with or meeting such regulations and expectations.
Compliance with new and existing data protection/privacy and AI statutes could increase our costs and expose the Company to possible fines for violation.
By reason of our Direct-to-Consumer business in particular, we collect personal data or personal information, which is broadly defined to include all information that can be linked or reasonably linked to an identified or identifiable individual, including identification information, demographics, transactions, preferences, and inferences drawn to create a profile about a consumer (“Personal Data”). We are subject to numerous data privacy and protection obligations governing our handling of Personal Data, including federal, state, local and foreign laws, regulations, and guidance; industry standards; external and internal privacy notices and policies; contracts; and other obligations (“Applicable Data Privacy Obligations”). These obligations may change, are subject to differing interpretations, and may be inconsistent across jurisdictions in which we operate, collect, or process Personal Data. The data privacy and protection landscape continues to evolve worldwide, which may create uncertainty in our business; affect us or our service providers’ and others’ ability to operate in certain jurisdictions or to collect, store, transfer, use, share, and otherwise process Personal Data; necessitate more onerous contractual obligations; result in liabilities; or otherwise impose additional compliance costs. Moreover, despite our efforts, we may not be successful in achieving compliance if our personnel or third parties upon whom we rely fail to comply with such obligations, which could result in significant consequences, including: government enforcement actions; litigation (including class-related claims); additional reporting requirements and/or oversight; orders to destroy or not use Personal Data; damage to our reputation; loss of revenue and profits; loss of goodwill; and other adverse business impacts.
Applicable Data Privacy Obligations are imposed in several international jurisdictions in which we operate. In 2016, the European Union ("EU") adopted the General Data Protection Regulation (“GDPR”), effective May 2018, and the United Kingdom (“UK”) adopted similar privacy regulations, effective in 2021 (the “UK GDPR”). Because we offer goods and services in the EU and UK, we are likely subject to both, which impose a strict data protection compliance regime with severe penalties. We may also be subject to many other foreign privacy laws modeled at least in part after the GDPR, including Singapore's Personal Data Protection Act (PDPA), Hong Kong's Personal Data (Privacy) Ordinance (PDPO), Canada’s Personal Information Protection and Electronic Documents Act (PIPEDA) and territorial Canadian privacy laws, and the Privacy Acts of Australia and New Zealand.
Our Direct-to-Consumer business currently has limited international operations that would subject it to these foreign privacy laws. Our Wholesale Sales & Ancillary Services segment maintains offices in Singapore that provide marketing support services and executes trades for its international customers. We have evaluated foreign privacy laws and believe we are currently in compliance in all material respects. Going forward, however, the expansion of our international operations could require us to change our business practices and increase the costs and complexity of compliance. A violation of applicable foreign laws could expose us to penalties and sanctions.
26
Additionally, numerous U.S. states have enacted consumer privacy laws and, in some instances, promulgated additional regulations and rules, which impose significant obligations on businesses within scope, including responding to data privacy rights (such as the right to delete, access, correct data or opt out of data sale, sharing, or targeted advertising); data mapping, minimization, and transparency; privacy policy disclosures; risk assessments for certain processing; vendor and service provider management; and other compliance activities. Failure to comply may result in public investigations, significant fines and penalties, disgorgement of data, reputational harm, and other ramifications. Ongoing compliance with the varying requirements of these laws has subjected the Company to costs and legal fees and will subject the Company to additional costs and risks as additional laws take effect. For example, these laws may limit the Company’s ability to use Personal Data for advertising purposes, may limit the ways in which the Company may use certain categories of Personal Data, may require the Company to obtain consent from the consumer for certain processing activities, and may require revision of service provider contracts. These laws may also limit the Company’s ability to process sensitive Personal Data, which includes financial data, account information, identification card numbers, social security numbers, biometric data, and precise geolocation. As new consumer privacy laws take effect, the Company will assess and potentially update its policies, notices, procedures, and permissions in response. The Company may also have to update its advertising and marketing practices.
All fifty U.S. states and the District of Columbia have enacted data breach notification laws that may require us to notify investors, employees, regulators, and others in the event of a security breach. These laws may not be consistent, and compliance in the event of a widespread data breach may be difficult and costly. We may also be contractually required or otherwise obligated to notify investors and others of a security breach. Although we may have contractual protections against our service providers should they experience a security breach, any actual or perceived security breach could harm our reputation and brand, expose us to potential liability and require us to expend significant resources on data security and breach response. Any contractual protections with service providers may not be sufficient to protect us adequately from any such liabilities and losses.
We are also subject to various federal privacy laws, such as the Telephone Consumer Protection Act (TCPA) and the Controlling the Assault of Non-Solicited Pornography and Marketing Act (CAN-SPAM), which govern certain SMS text messaging, emails, and telephone communications with consumers, as well as rules and regulations promulgated by the Federal Trade Commission and State Attorney General’s Offices concerning consumer protection, privacy, and data security.
We have evaluated these state and federal privacy and data protection laws and believe we are currently in compliance in all material respects with those that are in effect. Going forward, however, the changes introduced by additional state privacy laws and similar regulations enacted by other jurisdictions, will subject the Company to additional costs and complexity of compliance, including changes to the Company’s security systems, policies, procedures, and practices. A violation of new privacy obligations could expose us to fines and other penalties.
To the extent the Company deploys AI or generative artificial intelligence (“GAI”) tools, we may be subject to emerging national and international laws and regulations concerning the development, training, and use of such AI and GAI tools. For example, several states have enacted laws concerning the use of GAI content, including requiring developers of GAI technologies to disclose summaries of datasets used in developing and training those services or use of GAI in customer interfaces, such as chatbots. Certain consumer state privacy laws include obligations and limitations concerning the use of Personal Data for training GAI tools or underlying models or for automated decision making in certain instances. The EU has recently enacted the EU AI Act, which imposes significant compliance and disclosure obligations on businesses that use, design, or deploy AI systems in the EU based on risk level. The Company evaluates our use of AI and GAI tools on an ongoing basis and has implemented policies and procedures to ensure compliance with applicable domestic and international laws related to their use. Failure to comply with applicable AI and GAI laws and regulations could result in regulatory investigations, fines, reputational harm, disgorgement of data, and other penalties. Use of AI and GAI tools without proper vetting and authorization could expose the Company to risks associated with improper processing of Personal Data, leakage or misuse of Company confidential data, breaches of contractual obligations, operational or reputational harm, as well as fines and other penalties if such uses violate applicable laws and regulations.
We are subject to other laws and regulations.
There are various other federal, state, local and foreign laws, ordinances and regulations that affect our trading business. For example, because of the nature and value of the products in which we deal, we are required to comply with the Foreign Corrupt Practices Act and a variety of anti-money laundering and know-your-customer rules in response to the USA Patriot Act.
The SEC has promulgated rules mandated by the Dodd-Frank Act regarding disclosure, on an annual basis, of the use of tin, tantalum, tungsten and gold, known as conflict minerals, in products manufactured by public companies. These rules require due diligence to determine whether such minerals originated from the Democratic Republic of Congo ("DRC") or an adjoining country and whether such minerals helped finance the armed conflict in the DRC.
27
The Company has concluded that it is not currently subject to the conflict minerals rules because it is not a manufacturer of conflict minerals under the definitions set forth in the rules. Depending on developments in the Company’s business, it could become subject to the rules at some point in the future. In that event, there will be costs associated with complying with these disclosure requirements, including costs to determine the origin of gold used in our products. In addition, the implementation of these rules could adversely affect the sourcing, supply and pricing of gold used in our products. Also, we may face disqualification as a supplier for customers and reputational challenges if the due diligence procedures we implement do not enable us to verify the origins for the gold used in our products or to determine that the gold is conflict free.
CFC operates under a California Finance Lenders License issued by the California Department of Financial Protection and Innovation. CFC is required to submit a finance lender law annual report to the state which summarizes certain loan portfolio and financial information regarding CFC. The Department of Financial Protection and Innovation may audit the books and records of CFC to determine whether CFC is in compliance with the terms of its lending license.
There can be no assurance that the regulation of our trading, Direct-to-Consumer, and lending businesses will not increase or that compliance with the applicable laws and regulations will not become more costly or require us to modify our business practices.
For other risks related to government regulation, see below this section and see “Risk Factors of General Applicability — We are subject to other laws and regulations,” below.
One or more states or municipalities could assert that the Company is liable for sales and use, commerce, or similar type of taxes, which could adversely affect our business.
We ship product to retail customers throughout the United States. In South Dakota v. Wayfair, Inc., et al ("Wayfair"), the U.S. Supreme Court ruled that states may charge tax on purchases made from out-of-state sellers, even if the seller does not have a physical presence in the taxing state. The effect of Wayfair was to uphold economic nexus principles in determining sales and use tax nexus. As a result of the decision, most states have adopted laws that require an out-of-state retailer to register and collect sales and use or other non-income type taxes upon meeting certain economic nexus standards regardless of whether the company has physical presence in the state. Although the Company believes it is complying with the applicable legislative requirements, and collecting tax where obligated to do so, our interpretation and application of the legislation may differ from the states, which could result in the states' attempt to impose additional tax liabilities, including potential penalties and interest. Furthermore, the requirements by state or local governments on out-of-state sellers to collect sales and use taxes could deter future sales, which could have an adverse impact on our business.
For other risks related to taxation, see “Risk Factors of General Applicability — Changes in tax law could adversely affect our business,” below.
We use lead providers and marketing affiliates to assist us in obtaining new customers, and if lead providers or marketing affiliates do not comply with an increasing number of applicable laws and regulations, or if our ability to use such lead providers or marketing affiliates is otherwise impaired, it could adversely affect our business.
We are dependent on third parties, referred to as lead providers (or lead generators) and marketing affiliates, as a source of new customers for our Direct-to-Consumer segment. Generally, lead providers operate, and also work with their own marketing affiliates who operate, separate websites to attract prospective customers and then sell those “leads” to online traders and lenders. Our marketing affiliates place our advertisements on their websites that direct potential customers to our websites. As a result, the success of our Direct-to-Consumer business depends materially on the willingness and ability of lead providers or marketing affiliates to provide us with customer leads at acceptable prices.
If regulatory oversight of lead providers or marketing affiliates is increased, through the implementation of new laws or regulations or the interpretation of existing laws or regulations, our ability to use lead providers or marketing affiliates could be restricted or eliminated. For example, the Consumer Financial Protection Bureau ("CFPB") has indicated its intention to examine compliance with federal laws and regulations by lead providers and to scrutinize the flow of non-public, private information between lead providers and lead buyers, such as us. Several states have enacted data broker registration laws that require businesses that, among other things, sell consumer Personal Data to third parties to register and honor opt-out or deletion requests by consumers. Over the past few years, several states have taken actions that have caused us to discontinue the use of lead providers in those states. While these discontinuations did not have a material adverse effect on us, other states may propose or enact similar restrictions on lead providers and potentially on marketing affiliates in the future, and if other states adopt similar restrictions, our ability to use lead providers or marketing affiliates in those states would also be interrupted.
The failure by lead providers or marketing affiliates to comply with applicable laws or regulations, or any changes in laws or regulations applicable to lead providers or marketing affiliates or changes in the interpretation or implementation of such laws or regulations, could have an adverse effect on our business and could increase negative perceptions of our business and industry. Additionally, the use of lead providers and marketing affiliates could subject us to additional regulatory cost and expense. If our ability to use lead providers or marketing affiliates were to be impaired, our business could be materially adversely affected.
28
Judicial decisions, CFPB rulemaking, or amendments to the Federal Arbitration Act could render the arbitration agreements we use illegal or unenforceable.
We include arbitration provisions in our loan and financing agreements and in our Direct-to-Consumer terms and conditions. These provisions are designed to allow us to resolve any customer disputes through individual arbitration rather than in court and explicitly provide that all arbitrations will be conducted on an individual and not on a class basis. Thus, our arbitration agreements, if enforced, have the effect of shielding us from class action liability. Our arbitration agreements do not generally have any impact on regulatory enforcement proceedings. We take the position that the arbitration provisions in loan and financing agreements, including class action waivers, are valid and enforceable; however, the enforceability of arbitration provisions is often challenged in court. If those challenges are successful, our arbitration and class action waiver provisions could be unenforceable, which could subject us to additional litigation, including class action litigation.
In addition, the U.S. Congress has considered legislation that would generally limit or prohibit mandatory arbitration agreements in consumer contracts and has enacted legislation with such a prohibition with respect to certain mortgage loan agreements and also certain consumer loan agreements to members of the military on active duty and their dependents. Further, the Dodd-Frank Act directed the CFPB to study consumer arbitration and authorized the CFPB to adopt rules limiting or prohibiting consumer arbitration, consistent with the results of its study. In July 2017, the CFPB issued a new rule on arbitration, which would have prohibited class action waivers in certain consumer financial services contracts. However, in November 2017, a joint resolution passed by Congress was signed disapproving the rule under the Congressional Review Act. Because the rule was disapproved, it cannot be reissued in substantially the same form, and the CFPB cannot issue a substantially similar rule, unless the new rule is specifically authorized by a law enacted after the date of the joint resolution disapproving the original rule.
Any judicial decisions, legislation or other rules or regulations that impair our ability to enter into and enforce consumer arbitration agreements and class action waivers could increase our exposure to class action litigation as well as litigation in plaintiff-friendly jurisdictions, which would be costly and could have a material adverse effect on our business.
Our advertising and marketing materials and disclosures related to our Direct-to-Consumer and Secured Lending segments have been and continue to be subject to regulatory scrutiny.
In the jurisdictions where our Direct-to-Consumer and Secured Lending businesses operate, our advertising and marketing activities and disclosures are subject to regulation under various industry standards, borrower protection laws, and other applicable laws and regulations. As a whole, our advertising and marketing materials have come under increased scrutiny.
There can be no guarantee that we will be able to continue advertising and marketing our business units in a manner we consider effective. Any inability to do so could have a material adverse effect on our business.
Risks Relating to Our Common Stock
We may not continue to pay any dividends in the future.
Our board of directors has adopted a regular quarterly cash dividend policy of $0.20 per common share ($0.80 per share on an annual basis), beginning in October 2022. The most recent cash dividend under the policy was declared on August 31, 2026. The declaration of regular cash dividends in the future is subject to the determination each quarter by our board of directors, based on a number of factors, including the Company’s financial performance, available cash resources, cash requirements and alternative uses of cash and applicable bank covenants.
There can be no assurance that the Company will pay dividends in the future on a regular basis or otherwise. If our board of directors were to determine not to pay dividends in the future, stockholders would not receive any further return on an investment in our capital stock in the form of dividends and may obtain an economic benefit from the common stock only after an increase in its trading price and only by selling the common stock.
The Company has paid non-recurring special cash dividends to our stockholders as a consequence in part of the Company's favorable performance during the periods preceding the declaration. There is no assurance that any such non-recurring special dividend will be paid in the future, and if made, the timing or amount of any such dividend.
See Note 17 and Note 20 to the Company's consolidated financial statements for more information regarding our dividends.
29
Your percentage ownership in the Company could be diluted in the future.
Your percentage ownership in the Company potentially could be diluted in the future because of additional common stock-based equity awards that we expect will be granted to our directors, officers and employees, including through our current equity incentive plan. In addition, we may issue equity in order to raise capital or in connection with future acquisitions and strategic investments, which could dilute your percentage ownership. For example, in the acquisitions of JMB, LPM, SGI, and Monex, we issued stock to the sellers in partial consideration for the acquired interests. We also issued stock to TPM, S.A. de C.V. (which, collectively with its affiliates, we refer to as Tether) in connection with its recent investment in the Company.
Provisions in our Certificate of Incorporation and Bylaws and of Delaware law may prevent or delay an acquisition of the Company, which could decrease the trading price of our common stock.
Our amended and restated certificate of incorporation and amended and restated bylaws and Delaware law contain certain anti-takeover provisions that could have the effect of making it more difficult for a third-party to acquire, or of discouraging a third-party from attempting to acquire, control of the Company without negotiating with our board of directors. Such provisions could limit the price that certain investors might be willing to pay in the future for the Company’s securities. Certain of such provisions allow the Company to issue preferred stock with rights senior to those of the common stock, impose various procedural and other requirements which could make it more difficult for stockholders to effect certain corporate actions and set forth rules regarding how stockholders may present proposals or nominate directors for election at stockholder meetings.
We believe these provisions protect our stockholders from coercive or otherwise unfair takeover tactics by requiring potential acquirors to negotiate with our board of directors and by providing our board of directors with more time to assess any acquisition proposal. However, these provisions apply even if an acquisition offer may be considered beneficial by some stockholders and could delay or prevent an acquisition that our board of directors determines is not in the best interests of our Company and our stockholders. Accordingly, in the event that our board determines that a potential business combination transaction is not in the best interests of our Company and our stockholders, but certain stockholders believe that such a transaction would be beneficial to the Company and its stockholders, such stockholders may elect to sell their shares in the Company and the trading price of our common stock could decrease.
Our board and management beneficially own or represent owners of a sizable percentage of our common stock and therefore have the ability to exert substantial influence as stockholders.
Members of our board and management beneficially own or represent owners of approximately 29% of our outstanding common stock. Acting together in their capacity as stockholders, the board members and management could exert substantial influence over matters on which a stockholder vote is required, such as the approval of business combination transactions. Also because of the size of their beneficial ownership, the board members and management may be in a position effectively to determine the outcome of the election of directors and the vote on stockholder proposals. The concentration of beneficial ownership in the hands of our board and management may therefore limit the ability of our public stockholders to influence the affairs of the Company.
Risk Factors of General Applicability
We intend to continue to pursue selective acquisitions and investments to complement our organic growth, which may not be successful.
As part of our operating strategy, we have sought, and in the future may seek, to supplement our organic growth through strategic acquisitions of and investments in other businesses, including e-commerce retailers of coins and precious metals. Our recent acquisitions of SGI, Monex, and of the interests in AMS, Pinehurst, and SMI that we did not previously own are examples of this strategy. In the future, however, we may not be able to identify suitable acquisition or investment candidates. If we are unable to successfully execute on organic growth opportunities or complete acquisitions or investments in the future, or if we incur greater than anticipated costs to execute this strategy, our growth may be limited. For example, there is no guarantee that any of the recent acquisitions will achieve a level of profitability that justifies the purchase price paid for these businesses or that the integration of these entities with the Company’s other businesses will not divert management time and other resources as a result of which the Company’s other businesses will suffer. Accordingly, to the extent that we grow through acquisitions or investments, we cannot ensure that we will be able to adequately or profitably manage this growth.
30
Legislatures and regulators continue to scrutinize cybersecurity management and incident reporting.
Legislatures and regulators continue to scrutinize and mandate disclosures concerning cybersecurity risk management, strategy, governance, and incident reporting. In addition to the California Privacy Protection Agency’s (CPPA) recent passage of regulations that require businesses within scope of the California Consumer Privacy Act (CCPA) and meeting other criteria to engage in cybersecurity audits of over a dozen cybersecurity program components commencing as early as April 2028, other regulators and legislatures remain focused on cybersecurity and data protection. For example, the SEC has adopted rules requiring public companies to disclose material cybersecurity incidents and detail their risk management practices, while the Federal Trade Commission (FTC) actively brings enforcement actions against organizations that fail to implement reasonable security measures or that misrepresent their cybersecurity posture. While the Company believes it has robust cybersecurity risk management procedures for addressing cybersecurity events, this new audit requirement and existing cybersecurity rules and disclosure obligations may increase the costs of cybersecurity protection and require disclosure of cybersecurity events that the Company might not otherwise deem to be material.
The Company’s failure or inability to protect its intellectual property could harm its competitive position.
The Company relies on a combination of patent, trade secret, copyright and trademark laws and contractual restrictions, such as confidentiality agreements and licenses, to protect its business, services, know-how and information. The Company’s patent, trademarks, or service marks may be challenged or found to be unenforceable, and contractual arrangements to protect our intellectual property may be insufficient to prevent its misappropriation. If that were the case, the Company’s competitive position would suffer.
Third parties may assert violations of their intellectual property rights against the Company.
Third parties may currently have, or may be issued, patents upon which the technologies used by the Company are alleged to infringe. The Company could incur significant costs to defend infringement claims, regardless of their validity, or could be required to develop non-infringing technology at considerable expense or be compelled to enter into expensive royalty or license agreements. For example, JMB was compelled to expend significant resources as a consequence of litigation in which it was accused of infringement prior to its acquisition by the Company.
We are subject to other laws and regulations.
In addition to matters discussed above, we are subject to various laws and regulations, both domestic and foreign, as well as responsible business, social and environmental practices, which may change from time to time. Failure to comply with applicable laws and regulations or to implement responsible business practices could subject us to damage to our reputation, lawsuits, criminal exposure, or increased cost of regulatory compliance.
Changes in tax law could adversely affect our business.
Changes to tax laws (which changes may have retroactive application) could adversely affect us or holders of our common stock. It cannot be predicted whether, when, in what form, or with what effective dates, new tax laws or regulations may be enacted under existing or new tax laws. This could result in an increase in our tax liability or require changes in our business in order to mitigate any adverse effects of changes in tax laws.
Third-party expectations relating to ESG factors may impose additional costs and expose us to new risks.
In recent years, there has been an increasing focus by stakeholders of public companies—including investors, employees, customers, suppliers, and governmental and non-governmental organizations—on ESG matters. A failure, whether real or perceived, to address ESG could adversely affect our business, including by heightening other risks that we face, such as those related to consumer behavior and consumer perceptions of us. We may also face pressure from stakeholders to provide disclosure and establish commitments, targets or goals, and take actions to meet them, regarding ESG. If we fail to satisfy the expectations of investors and other stakeholders or our initiatives are not executed as planned, our reputation, results of our operations and ability to grow our business may be negatively impacted. Additionally, new legislative or regulatory initiatives related to ESG could adversely affect our business.
ITEM 1B. UNRESOLVED STAFF COMMENTS
None.
31
ITEM 1C. CYBERSECURITY
Cybersecurity Risk Management and Strategy
Our Cybersecurity Program includes multiple policies, procedures, and other components designed to identify, analyze, and respond to cybersecurity risks, including a layered system of preventative and detective technologies and controls designed to detect, mitigate, and contain cybersecurity threats. We maintain a Written Information Security Plan that outlines internal controls and procedures designed to protect our information systems. Our policies are commensurate with companies in our industry of similar size and sophistication, and are informed by the sensitivity of our data processing activities, and
Our designated IT team members monitor cybersecurity threats in real time for the Company at the enterprise level, with the assistance of third-party threat detection and monitoring software, as well as at the subsidiary level by experienced IT professionals. These individuals
We also maintain a formal Vendor Management Program that provides oversight of cybersecurity risks related to our vendor relationships. During vendor onboarding, we perform risk-based due diligence, with heightened requirements for vendors that access confidential enterprise information, personal data or our information systems. This Vendor Management Program includes specific cybersecurity requirements for our vendors, as well as ongoing monitoring, assessment, and contract review. The Vendor Management Program is overseen by members of the Company's IT and Legal Departments.
The Gold.com General Counsel, Chief Privacy Officer ("CPO"), IT leadership, and other representatives from the Company and its subsidiaries, including top-level management, ensure enterprise-wide implementation and consistent application of the Company’s data security, privacy, vendor management, and artificial intelligence policies and procedures.
To date,
Cybersecurity Governance
32
The Company IT leadership and CPO directly oversee information technology and information security risks through regular quarterly meetings and related risk assessments.
ITEM 2. PROPERTIES
As of June 30, 2026, the Company owned or leased properties as described below:
Location |
|
General Use of Facility |
|
Square |
|
|
Ownership |
|
Lease-term Expiration |
|
Wholesale Sales & Ancillary Services Segment |
|
|
|
|
|
|
|
|||
Costa Mesa, California (1)(2) |
|
Corporate headquarters and support center |
|
|
27,973 |
|
|
Leased |
|
August-2027 |
Las Vegas, Nevada |
|
Storage and fulfillment logistics operations |
|
|
24,743 |
|
|
Leased |
|
April-2030 |
Las Vegas, Nevada |
|
Warehouse |
|
|
14,614 |
|
|
Leased |
|
September-2030 |
Winchester, Indiana |
|
Minting operations |
|
|
17,000 |
|
|
Owned |
|
not applicable |
Winchester, Indiana |
|
Minting operations |
|
|
5,000 |
|
|
Owned |
|
not applicable |
Winchester, Indiana |
|
Fabrication facility |
|
|
17,000 |
|
|
Leased |
|
May-2028 |
Carson City, Nevada |
|
Die-cutting and engraving facility |
|
|
2,000 |
|
|
Leased |
|
month-to-month |
Henderson, Nevada |
|
Minting operations |
|
|
141,815 |
|
|
Leased |
|
September-2032 |
Hayden, Idaho |
|
Minting operations |
|
|
8,000 |
|
|
Leased |
|
December-2027 |
Shanghai, China |
|
Minting operations |
|
|
23,681 |
|
|
Leased |
|
June-2034 |
Vienna, Austria |
|
International marketing support operations |
|
|
248 |
|
|
Leased |
|
every three months |
Hong Kong |
|
Regional headquarters and support center |
|
|
15,000 |
|
|
Leased |
|
April-2031 |
Hong Kong |
|
Numismatics showroom |
|
|
3,500 |
|
|
Leased |
|
January-2028 |
Singapore |
|
Corporate office and support center |
|
|
250 |
|
|
Leased |
|
August-2026 |
Pinehurst, North Carolina (2) |
|
Corporate office and support center |
|
|
10,000 |
|
|
Leased |
|
November-2035 |
|
|
|
|
|
|
|
|
|
|
|
Direct-to-Consumer Segment |
|
|
|
|
|
|
|
|
|
|
Los Angeles, California |
|
Corporate office and support center |
|
|
11,468 |
|
|
Leased |
|
January-2028 |
Dallas, Texas |
|
Corporate office and support center |
|
|
3,245 |
|
|
Leased |
|
November-2028 |
Dallas, Texas |
|
Corporate office and support center |
|
|
10,586 |
|
|
Leased |
|
November-2028 |
Irving, Texas |
|
Distribution hub |
|
|
24,640 |
|
|
Leased |
|
April-2031 |
Calgary, Canada |
|
Corporate office and support center |
|
|
22,650 |
|
|
Leased |
|
August-2028 |
Calgary, Canada |
|
Corporate office and support center |
|
|
4,176 |
|
|
Leased |
|
August-2027 |
Newport Beach, California |
|
Corporate office and support center |
|
|
22,875 |
|
|
Leased |
|
August-2030 |
Burnsville, Minnesota |
|
Warehouse |
|
|
23,319 |
|
|
Leased |
|
June-2027 |
Eagan, Minnesota |
|
Corporate office and support center |
|
|
44,298 |
|
|
Leased |
|
August-2039 |
Tulsa, Oklahoma |
|
Retail office and support center |
|
|
3,200 |
|
|
Leased |
|
May-2030 |
Hong Kong |
|
Retail office and support center |
|
|
4,684 |
|
|
Leased |
|
June-2029 |
Miami, Florida |
|
Retail office, walk-in showroom |
|
|
3,500 |
|
|
Leased |
|
August-2034 |
Costa Mesa, California |
|
Corporate office, auction and event venue |
|
|
12,691 |
|
|
Leased |
|
August-2027 |
Santa Ana, California |
|
Warehouse |
|
|
41,722 |
|
|
Leased |
|
April-2030 |
Philadelphia, Pennsylvania |
|
Retail office and support center |
|
|
3,128 |
|
|
Leased |
|
September-2028 |
San Francisco, California |
|
Retail office and support center |
|
|
4,839 |
|
|
Leased |
|
June-2035 |
New York, New York |
|
Retail, auction and event venue |
|
|
2,150 |
|
|
Leased |
|
October-2029 |
Boston, Massachusetts |
|
Retail office and support center |
|
|
5,662 |
|
|
Leased |
|
April-2032 |
Newport Beach, California |
|
Warehouse |
|
|
3,025 |
|
|
Leased |
|
February-2027 |
Wolfboro, New Hampshire |
|
Retail office and support center |
|
|
2,000 |
|
|
Leased |
|
month-to-month |
Paris, France |
|
Retail office and support center |
|
|
250 |
|
|
Leased |
|
month-to-month |
Copenhagen, Denmark |
|
Retail office |
|
|
1,851 |
|
|
Leased |
|
month-to-month |
Singapore |
|
Corporate office and support center |
|
|
2,020 |
|
|
Leased |
|
March-2027 |
|
|
|
|
|
|
|
|
|
|
|
(1) The Secured Lending segment shares office space at this facility. |
||||||||||
(2) The Direct-to-Consumer segment shares office space at this facility. |
||||||||||
ITEM 3. LEGAL PROCEEDINGS
We are from time to time involved in legal proceedings, claims, or investigations that are incidental to the conduct of our business.
33
Although the ultimate outcome of any legal matter cannot be predicted with certainty, based on current information, including our assessment of the merits of the particular claim, we do not expect that these legal proceedings or claims will have any material adverse impact on our future consolidated financial position, results of operations, or cash flows.
ITEM 4. MINE SAFETY DISCLOSURES
None.
PART II
ITEM 5. MARKET FOR REGISTRANT'S COMMON EQUITY, RELATED STOCKHOLDER MATTERS AND ISSUER PURCHASES OF EQUITY SECURITIES
Market Information
Gold.com's shares of common stock are traded on the New York Stock Exchange under the symbol "GOLD". As of August 28, 2026, there were 107 registered stockholders of record of our common stock.
Stock Performance Graph
Set forth below is a graph comparing the cumulative total stockholder return on shares of Gold.com common stock against the cumulative total return of (i) the New York Stock Exchange ("NYSE") Composite Index and (ii) a group of companies that are in lines of business reasonably comparable to Gold.com's businesses ("peer companies") for the five-year period from June 30, 2021 to June 30, 2026. The graph assumes that $100 was invested on June 30, 2021 in our common stock, in the NYSE Composite Index companies and in the peer group companies (on a market-capitalization-weighted basis), and that all dividends were reinvested in the same class of stock.
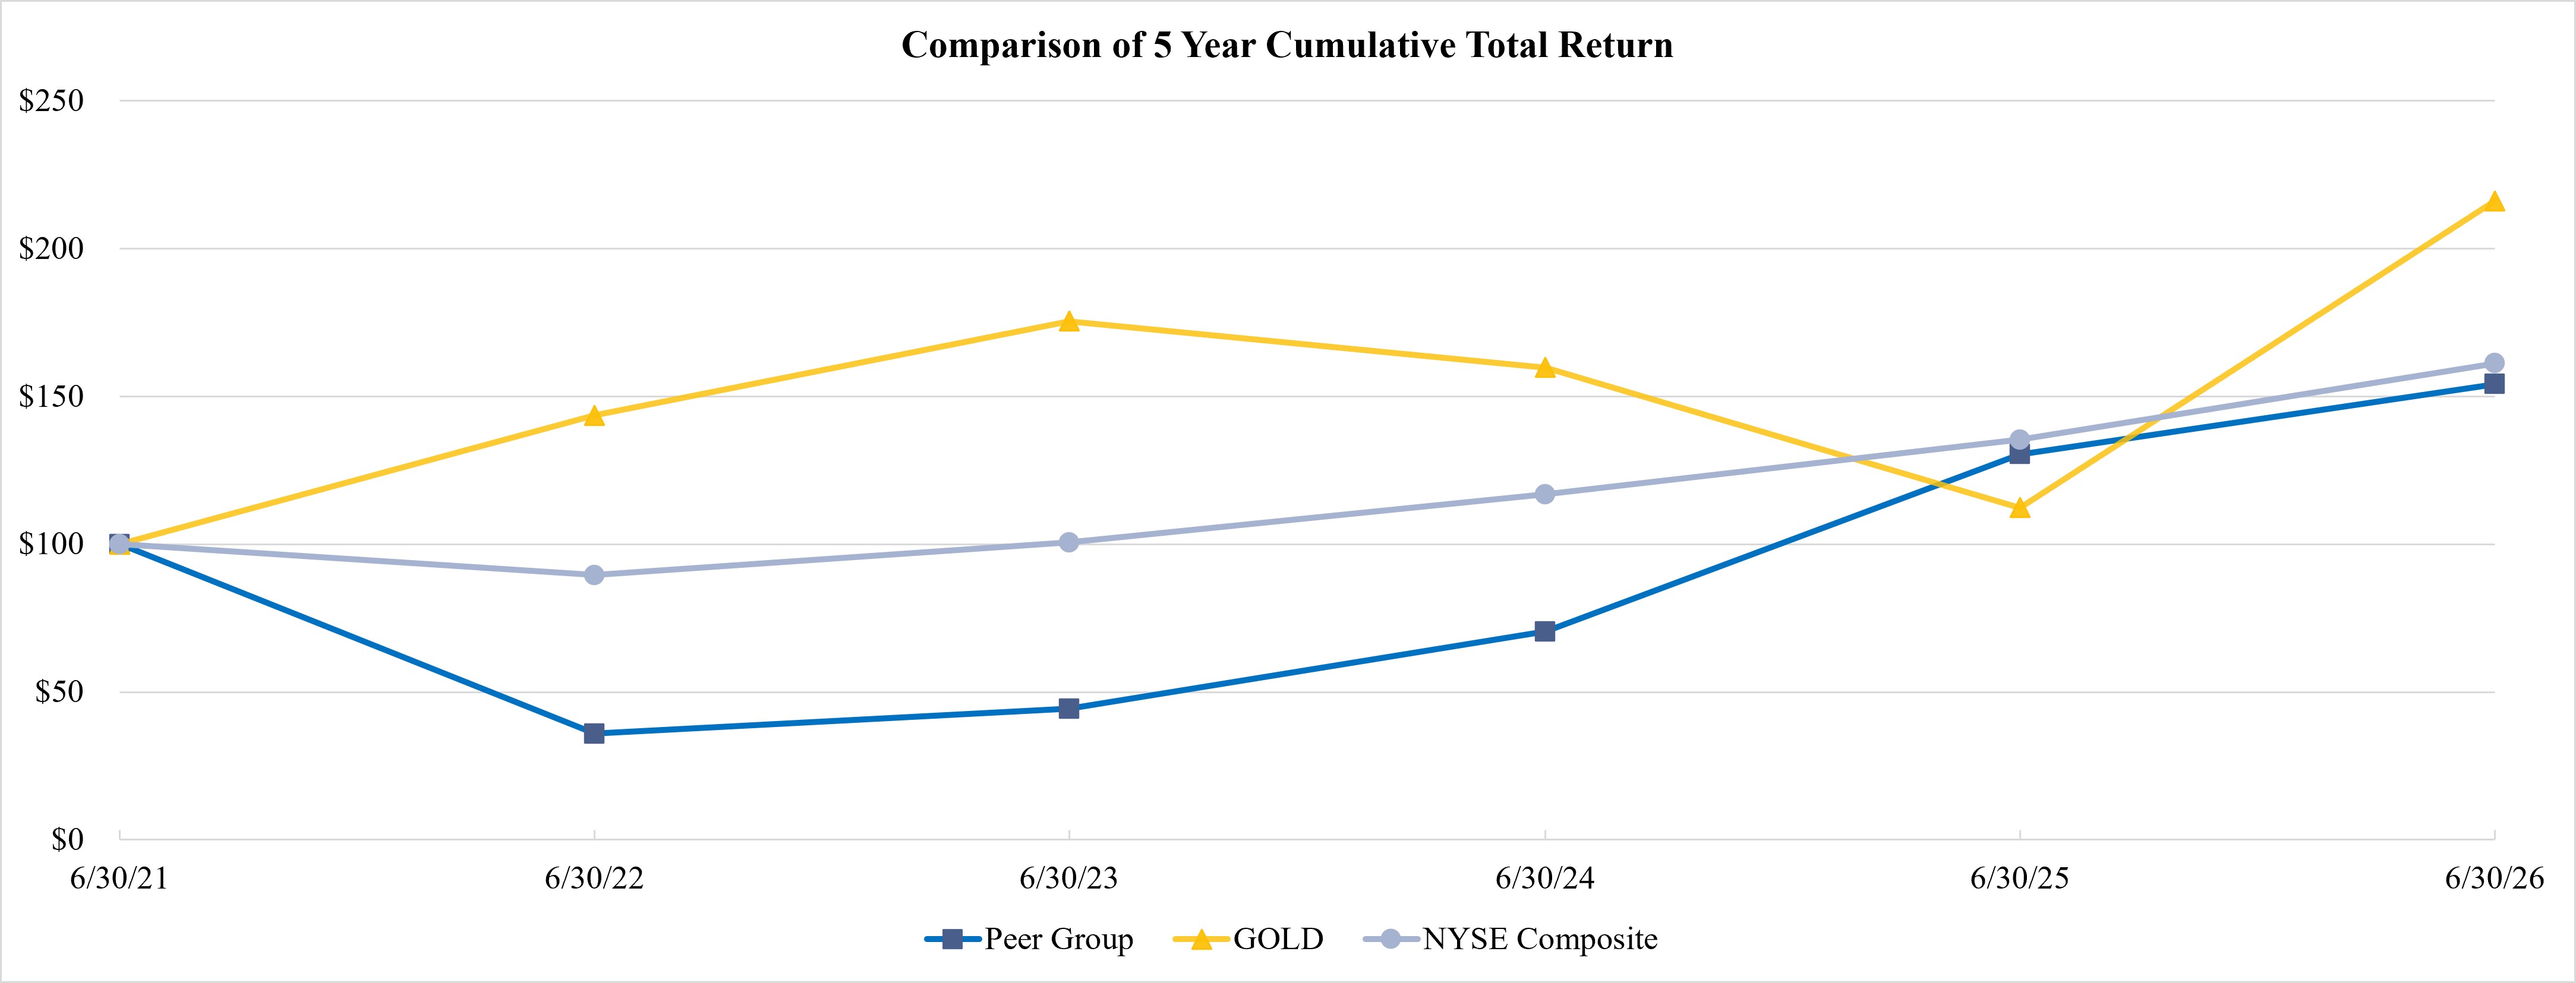
Below are the companies which comprise the peer group in the graph above, in the indicated lines of business:
Alternative Brokerage Firms |
Alternative Financial Services |
E-Commerce |
BGC Group, Inc. (BGC) |
Enova International, Inc. (ENVA) |
Carvana Co. (CVNA) |
IG Group Holdings plc (IGG.L) |
EZCORP, Inc. (EZPW) |
Stitch Fix, Inc. (SFIX) |
StoneX Group Inc. (SNEX) |
FirstCash Holdings, Inc. (FCFS) |
The Lovesac Company (LOVE) |
Swissquote Group Holding Ltd (SQN.SW) |
Regional Management Corp. (RM) |
Liquidity Services, Inc. (LQDT) |
B. Riley Financial, Inc. (RILY) |
World Acceptance Corporation (WRLD) |
Beyond, Inc. (BBBY) |
Oppenheimer Holdings Inc. (OPY) |
GreenDot Corporation (GDOT) |
PC Connection, Inc. (CNXN) |
Dividend Policy
The Company's board of directors has adopted a regular quarterly cash dividend policy of $0.20 per common share ($0.80 per share on an annual basis). While we currently intend to continue paying quarterly dividends, any future determination regarding the payment of dividends will be subject to the discretion of our board of directors and will be dependent on a number of factors, including the Company’s financial performance, available cash resources, cash requirements and alternative uses of cash and applicable bank covenants.
34
In fiscal 2025, the Company paid the following dividends:
In fiscal 2026, the Company paid the following dividends:
See Note 20 to the Company’s consolidated financial statements for more information regarding our dividends.
Equity Compensation Plan Information
The following table provides information as of June 30, 2026 with respect to the shares of our common stock that may be issued under existing equity compensation plans:
Plan category |
|
(a) |
|
|
(b) |
|
|
|
(c) |
|||||
Equity compensation plans approved by security holders |
|
|
840,469 |
|
|
$ |
8.70 |
|
(1) |
|
|
1,350,928 |
|
(2) |
Equity compensation plans not approved by security holders |
|
|
— |
|
|
|
— |
|
|
|
|
— |
|
|
|
|
|
840,469 |
|
|
$ |
8.70 |
|
(1) |
|
|
1,350,928 |
|
(2) |
Share Repurchase Program
In April 2018, the Company's board of directors approved a share repurchase program, which since has been amended to authorize the Company to purchase up to 3.3 million shares of its common stock. As of June 30, 2026, 1,321,003 shares had been repurchased and 2,000,000 shares remain authorized for repurchase under the program.
35
Under the share repurchase program, we may repurchase shares of our common stock from time to time at prevailing market prices, depending on market conditions, through open market or privately negotiated transactions. Subject to applicable securities laws, repurchases may be made at such times and in amounts as management deems appropriate. We are not obligated to repurchase any shares under the program, and repurchases under the program may be discontinued if management determines that additional repurchases are not warranted.
We did not repurchase any shares during the quarter ended June 30, 2026.
Recent Sales of Unregistered Equity Securities
In connection with its acquisition of Monex Deposit Company and certain related entities in January 2026, the Company issued 560,000 shares of its common stock. The consideration equaled $49.9 million, of which $19.2 million was attributable to the shares. The shares were issued in reliance upon Section 4(a)(2) of the Securities Act of 1933, as amended (the "Securities Act").
The Company sold an aggregate of 3,370,787 shares of its common stock to TPM, S.A. De C.V., a controlled subsidiary of Tether Global Investment Fund, S.I.C.A.F., S.A. at a price per share of $44.50 in cash. The sale was settled in two tranches on February 9, 2026 and May 5, 2026 for aggregate consideration of $150.0 million. The shares were issued in reliance upon Section 4(a)(2) of the Securities Act.
ITEM 6. [RESERVED]
36
ITEM 7. MANAGEMENT’S DISCUSSION AND ANALYSIS OF FINANCIAL CONDITION AND RESULTS OF OPERATIONS
CAUTIONARY STATEMENT PURSUANT TO THE PRIVATE SECURITIES LITIGATION REFORM ACT OF 1995
This Annual Report on Form 10-K ("Form 10-K") contains statements that are considered forward-looking statements. Forward-looking statements give the Company's current expectations and forecasts of future events. All statements other than statements of current or historical fact contained in this Annual Report, including statements regarding the Company's future financial position, business strategy, budgets, projected costs and plans, and objectives of management for future operations, are forward-looking statements. The words “anticipate,” “believe,” “continue,” “estimate,” “expect,” “intend,” “may,” “plan,” and similar expressions, as they relate to the Company, are intended to identify forward-looking statements. These statements are based on the Company's current plans, estimates and beliefs, and the Company's actual future activities and results of operations may be materially different from those set forth in the forward-looking statements. These forward-looking statements are subject to risks and uncertainties that could cause actual results to differ materially from the statements made. Any or all of the forward-looking statements in this Annual Report may turn out to be inaccurate. The Company has based these forward-looking statements largely on its current expectations and projections about future events and financial trends that it believes may affect its financial condition, results of operations, business strategy, and financial needs. The forward-looking statements can be affected by inaccurate assumptions or by known or unknown risks and uncertainties. The Company undertakes no obligation to publicly revise these forward-looking statements to reflect events occurring after the date hereof. All subsequent written and oral forward-looking statements attributable to the Company or persons acting on its behalf are expressly qualified in their entirety by the cautionary statements contained in this Form 10-K.
The following discussion and analysis of our financial condition and results of operations should be read in conjunction with the consolidated financial statements and notes contained elsewhere in this Form 10-K. This discussion contains forward-looking statements that reflect our plans, estimates and beliefs. Our actual results could differ materially from those discussed in these forward-looking statements. Factors that could cause or contribute to these differences include those factors discussed below and elsewhere in this Annual Report, particularly in “Risk Factors.”
INTRODUCTION
Management's discussion and analysis of financial condition and results of operations is provided as a supplement to the accompanying consolidated financial statements and related notes to aid in the understanding of our results of operations and financial condition. We have omitted discussion of our fiscal year 2024 results where it would be redundant to the discussion previously included in Item 7 of our fiscal year 2025 Annual Report on Form 10-K. Our discussion is organized as follows:
37
comparing results for the periods presented.
EXECUTIVE OVERVIEW
Our Business
Founded in 1965, Gold.com offers comprehensive solutions for all aspects of the precious metals (gold, silver, platinum, and palladium) and collectibles (including rare coins and currency) value chains. Our vertically integrated platform combines market expertise with state-of-the-art logistics, financing, and minting capabilities to serve customers, collectors, and institutional clients globally. We conduct our operations through three complementary segments: Wholesale Sales & Ancillary Services, Direct-to-Consumer, and Secured Lending.
Effective December 2, 2025, the Company changed its name to Gold.com, Inc. and transferred the listing of its common shares from the Nasdaq Stock Market to the New York Stock Exchange ("NYSE"). The shares of the Company are now being traded on the NYSE under the symbol "GOLD" as of December 2, 2025. Prior to December 2025, Gold.com, Inc. was operating as A-Mark Precious Metals, Inc.
Wholesale Sales & Ancillary Services
The Company operates its Wholesale Sales & Ancillary Services segment directly under the "A-Mark" brand and through its consolidated subsidiaries, A-Mark Trading AG (“AMTAG”), Transcontinental Depository Services, LLC ("TDS"), A-M Global Logistics, LLC (“AMGL” or "Logistics"), AM&ST Associates, LLC ("AMST" or the "Silver Towne Mint"), AM/LPM Ventures, LLC, which owns a majority interest in LPM Group Limited ("LPM"), Spectrum Group International, LLC, which was formed in February 2025 to acquire all of the stock of Spectrum Group International, Inc. ("SGI"), Pinehurst Coin Exchange, Inc. ("Pinehurst"), AM Precious Metals Singapore PTE Ltd., and Sunshine Minting, Inc. ("SMI").
The Wholesale Sales & Ancillary Services segment operates as a full-service precious metals company. We offer gold, silver, platinum, and palladium in the form of bars, plates, powder, wafers, grain, ingots, and coins. We sell thousands of coin and bar products in a variety of weights, shapes, and sizes for distribution to dealers and other qualified purchasers. We have a numismatics showroom in Hong Kong and a trading center in Costa Mesa, California. The trading center, for buying and selling precious metals, is available to receive orders 24 hours every day, even when many major world commodity markets are closed. We offer our customers a variety of ancillary services, including financing, storage, consignment, logistics, and various customized financial programs. As a U.S. Mint-authorized purchaser of gold, silver, platinum, and palladium coins, we purchase product directly from the U.S. Mint, and also purchase product from other sovereign mints, for sale to our customers.
38
During fiscal 2026 and prior, we marketed our goods and services to international markets through our AMTAG subsidiary, which has operated an overseas office in Vienna, Austria since 2009. We decided to close our office in Vienna effective early fiscal 2027 and have begun the process to dissolve AMTAG. Marketing operations previously conducted in Vienna have been shifted to other company offices.
Through its wholly-owned subsidiary TDS, the Company offers a variety of managed storage options for precious metals products to financial institutions, dealers, investors, and collectors around the world.
The Company's wholly-owned subsidiary AMGL is based in Las Vegas, Nevada, and provides our customers an array of complementary services, including receiving, handling, inventorying, processing, packing, and shipping of precious metals and custom coins on a secure basis.
Through its wholly-owned subsidiary AMST, the Company designs and produces minted silver products. Our Silver Towne Mint operations allow us to provide greater product selection to our customers as well as to gain increased access to silver during volatile market environments, which have historically created higher demand for precious metals products.
The Company operates LPM, its Asia headquarters, through its subsidiary AM/LPM Ventures, LLC. Based in Hong Kong, LPM offers the Company's full-service precious metals products and services in Asia and internationally.
We expanded our product portfolio in February 2025 through our acquisition of SGI, which is the parent company of Stack's Bowers Galleries, one of the world's largest rare coin and currency auction houses and a leading wholesale and retail dealer specializing in numismatic and bullion products. SGI also is the majority owner of Spectrum Wine, a global auctioneer, retailer, and storage provider of fine and rare wine. SGI's financial results and metrics attributable to its wholesale operations are included in our Wholesale Sales & Ancillary Services segment, and the financial results and metrics attributable to its auction and retail operations are included in our Direct-to-Consumer segment. (As used herein, and as the context may require, the term "SGI" refers to Spectrum Group International, Inc. and its successor company Spectrum Group International, LLC.)
Also in February 2025, the Company continued its expansion into the bullion adjacent collectible coin market through the acquisition of the remaining outstanding equity interests in Pinehurst Coin Exchange, Inc. ("Pinehurst") it did not previously own. Pinehurst is a leading precious metals broker that services the wholesale and retail marketplace and is one of the nation’s largest e-commerce retailers of modern and numismatic coins on eBay. Pinehurst markets a broad range of bullion and is a leader in selling coins produced by the U.S. Mint, the Royal Canadian Mint, and other highly regarded sovereign mints that have been evaluated by leading grading agencies. Pinehurst's financial results and metrics attributable to its wholesale operations are included in our Wholesale Sales & Ancillary Services segment, and the financial results and metrics attributable to its retail operations are included in our Direct-to-Consumer segment.
In April 2026, we acquired the remaining equity interests in Sunshine Minting, Inc. ("SMI") that we did not previously own. SMI is a leading domestic and global supplier of precious metal mint products with manufacturing facilities in Nevada and Idaho, as well as a joint venture in Shanghai, China. As the primary supplier of precious metal blanks struck by the United States Mint to create bullion, and a trusted partner to many of the world's largest sovereign mints, SMI also manufactures legal tender bullion for several countries, serving sovereign governments, major marketing companies, financial institutions, corporations, and private groups around the world.
Direct-to-Consumer
The Company operates its Direct-to-Consumer ("DTC") segment through its wholly-owned subsidiaries JM Bullion, Inc. (“JMB”), Goldline, Inc. (“Goldline”), SGI, Pinehurst, AMS Holding, LLC ("AMS"), AM LPM Singapore PTE Ltd., Monex Deposit Company ("Monex") and through its investment in Silver Gold Bull, Inc. ("SGB"). JMB has several wholly-owned subsidiaries, including: Buy Gold and Silver Corp. ("BGASC"), BX Corporation ("BullionMax"), Gold Price Group, Inc. (“GPG”), Silver.com, Inc. (“Silver.com”), Provident Metals Corp. (“PMC”), and CyberMetals Corp. ("CyberMetals"). Goldline owns 100% of AM IP Assets, LLC ("AMIP"). SGB and Goldline each have a 50% ownership interest in Precious Metals Purchasing Partners, LLC ("PMPP"). As the context requires, references to JMB may include BGASC, BullionMax, GPG, Silver.com, PMC, and CyberMetals, and references to Goldline may include AMIP and PMPP.
JMB is a leading e-commerce retailer providing access to a broad array of gold, silver, copper, platinum, and palladium products through its websites. JMB owns and operates numerous websites targeting specific niches within the precious metals retail market, including JMBullion.com, ProvidentMetals.com, Silver.com, CyberMetals.com, GoldPrice.org, SilverPrice.org, BGASC.com, BullionMax.com, and Gold.com. Typically, JMB offers approximately 8,000 different products during a fiscal year, measured by stock keeping units or SKUs, on its websites. This number can vary over time, particularly when demand is high and certain SKUs may be out of stock.
39
In April 2022, JMB commercially launched the CyberMetals online platform, where customers can purchase and sell fractional shares of digital gold, silver, platinum, and palladium bars in a range of denominations. CyberMetals’ customers have the option to convert their digital holdings to fabricated precious metals products via an integrated redemption flow with JMB. These products may be designated by the customer for storage by the Company or shipped directly to the customer.
The Company acquired Goldline in August 2017 through an asset purchase transaction with Goldline, LLC, which had been in operation since 1960. Goldline is a direct retailer of precious metals to the investor community, and markets its precious metal products on television, radio, and the internet, as well as through customer service outreach. Goldline’s subsidiary AMIP manages its intellectual property. PMPP was formed in fiscal 2019 pursuant to terms of a joint venture agreement with SGB, for the purpose of purchasing precious metals from the partners' retail customers, and then reselling the acquired products back to affiliates of the partners. PMPP commenced operations in fiscal 2020.
In 2014, the Company acquired its initial ownership interest in SGB, a leading e-commerce precious metals retailer in Canada. Through its website, SilverGoldBull.com, SGB offers a variety of products from gold, silver, platinum, and palladium in the form of bars, coins and rounds, as well as certified coins from mints around the world. In 2018 and 2022, the Company made incremental investments to increase its ownership interest in SGB to 47.4% as of June 2022. Also in June 2022, the Company acquired an option to purchase an additional 27.6% of the outstanding equity of SGB to bring the Company's ownership interest up to 75%. In June 2024, the Company exercised part of its option and acquired an additional 8% ownership interest in SGB for $9.6 million, increasing its ownership interest to 55.4%, at which point SGB became a consolidated subsidiary of the Company. The increased investment in SGB allows the Company to continue its strategy to further expand internationally, particularly in Canada.
SGI, which we acquired in February 2025, is the parent company of Stack's Bowers Galleries, which is one of the world's largest rare coin and currency auction houses and a leading wholesale and retail dealer specializing in numismatic and bullion products. Its auction services unit conducts in-person, internet and specialized auctions of consigned and owned items and has sold a wide range of the most important rarities and numismatic collections over its distinguished history. SGI's financial results and metrics attributable to its wholesale operations are included in our Wholesale Sales & Ancillary Services segment, and the financial results attributable to its auction and retail operations are included in our Direct-to-Consumer segment.
In February 2025, the Company acquired the remaining outstanding equity interests in Pinehurst it did not previously own. Pinehurst is a leading precious metals broker that services the wholesale and retail marketplace and is one of the nation’s largest e-commerce retailers of modern and numismatic coins on eBay. Pinehurst operates the www.PinehurstCoins.com and www.ModernCoinMart.com websites. Pinehurst's financial results and metrics attributable to its wholesale operations are included in our Wholesale Sales & Ancillary Services segment, and the financial results attributable to its retail operations are included in our Direct-to-Consumer segment.
The Company, in connection with its acquisition of LPM in February 2024, formed a joint venture with Stack's Bowers Galleries and Pinehurst to acquire a 10% interest in AMS. In April 2025, the Company acquired the remaining 90% of its outstanding equity interests it did not previously own. The Company had supplied bullion and related products to AMS for over ten years. The foundation of AMS brings together four decades of collector relationships with modern technology and compelling coin offerings that are sold through the GOVMINT brand and continues the Company's strategy to expand its footprint into the luxury precious metals market.
After decades of collaboration, in January 2026, we acquired Monex, one of the largest and most established direct-to-consumer precious metals dealers in the US. Monex was founded in 1987 and provides investors with access to gold, silver, platinum, and palladium through a full-service platform along with vault storage.
Secured Lending
The Company operates its Secured Lending segment through its wholly-owned subsidiary, Collateral Finance Corporation, LLC, including its wholly-owned subsidiary, CFC Alternative Investments (“CAI”) (collectively “CFC”).
CFC is a California licensed finance lender that originates and acquires commercial loans secured primarily by bullion and numismatic coins. CFC's customers include coin and precious metal dealers, investors, and collectors. As of June 30, 2026, CFC had $115.1 million in secured loans outstanding, of which 2% were acquired from third parties (some of which may be customers of the Company) and approximately 98% were originated by CFC.
CAI is a holding company that has a 50%-ownership stake in Collectible Card Partners, LLC ("CCP") as of June 30, 2026. CCP provides capital to fund commercial loans secured by graded sports cards. (See Note 14.) Effective July 2026, CAI's ownership interest in CCP increased to 75%.
40
Our Strategy
The Company was formed in 1965 and has grown into a significant participant in the bullion and coin markets, with $25.5 billion in revenues for fiscal year 2026. We have remained active in seeking investment opportunities to strategically enhance our business, and also continue to focus on growth in the volume of our business, our geographic presence, and the scope of complementary products, services, and technological tools that we offer to our customers. In doing so, we seek to leverage off the strengths of our existing integrated operations, which span trading, e-commerce, distribution, logistics, minting, storage, hedging, financing, and consignment products and services, including:
Our Customers
Our customers include financial institutions, bullion retailers, industrial manufacturers and fabricators, sovereign mints, refiners, coin and metal dealers, investors, collectors, and e-commerce and other retail customers. The Company makes a two-way market in its wholesale operations, which results in many customers also operating as our suppliers in that segment. This diverse base of wholesale customers purchases a variety of products from the Company in a multitude of grades, primarily in the form of coins and bars. Our Direct-to-Consumer segment sells to (and, through certain subsidiaries, buys from) retail customers, with JMB, SGB, Pinehurst, Monex, and AMS focusing on e-commerce operations and Goldline marketing through various traditional and e-commerce channels to the investor community. The Direct-to-Consumer segment offers these customers a variety of gold, silver, copper, platinum, and palladium products.
Factors Affecting Revenues, Gross Profit, Interest Income, and Interest Expense
Set forth below are the key factors affecting the Company’s revenues, gross profit, interest income, and interest expense. These factors may be attributable to both the Company’s ongoing business activities as well as from Company acquisitions.
Revenues. The Company enters into transactions to sell and deliver gold, silver, platinum, and palladium to industrial and commercial users, coin and bullion dealers, mints, and financial institutions. The metals are investment or industrial grade and are sold in a variety of shapes and sizes.
The Company also sells and delivers gold, silver, platinum, palladium, and copper products directly to customers and the investor community through its Direct-to-Consumer segment. Customers may place orders online at one of the Company's websites or over the phone.
The Company sells precious metals on forward contracts at a fixed price based on current prevailing precious metal spot prices with a certain delivery date in the future (up to six months from inception date of the forward contract). The Company also uses other derivative products (primarily futures contracts) or combinations thereof to hedge commodity risks. We enter into these forward and futures contracts as part of our hedging strategy to mitigate our price risk of holding inventory; they are not entered into for speculative purposes.
41
Forward sales contracts by their nature are required to be included in revenues, unlike futures contracts which do not impact the Company’s revenue. The decision to use a forward contract versus another derivative type of product (e.g., a futures contract) for hedging purposes is based on the economics of the transaction. Since the volume of hedging can be significant, the movement in and out of forwards can substantially impact revenues, either positively or negatively, from period to period. For this reason, the Company believes ounces sold (excluding ounces sold on forward sales contracts) is a meaningful metric to assess our top line performance.
In addition, the Company earns revenue by providing storage solutions for precious metals and numismatic coins for financial institutions, dealers, investors, and collectors worldwide and by providing storage and order-fulfillment services to our retail customers. The Company also earns fees for facilitating specialized auctions of numismatics, through providing minting and refining services, and from advertisements placed on our Direct-to-Consumer websites. These revenue streams represent less than 5% of the Company’s consolidated revenues.
The Company operates in a high volume/low margin industry. Revenues are impacted by three primary factors: product volume, market prices, and market volatility. A material change in any one or more of these factors may result in a significant change in the Company’s revenues. A significant increase or decrease in revenues can occur simply based on changes in the underlying commodity prices and may not be reflective of an increase or decrease in the volume of products sold.
Gross Profit. Gross profit is the difference between our revenues and the cost of our products sold. Since we quote prices based on the current commodity market prices for precious metals, we often enter into a combination of forward and futures contracts to effect a hedge position equal to the underlying precious metal commodity value, which substantially represents inventory subject to price risk. We enter into these derivative transactions solely for the purpose of hedging our inventory, and not for speculative purposes. Our gross profit includes the gains and losses resulting from these derivative instruments. However, the gains and losses on the derivative instruments are substantially offset by the gains and losses on the corresponding changes in the market value of our precious metals inventory. As a result, our results of operations generally are not materially impacted by changes in commodity prices.
Interest Income. The Company enters into secured loans and secured financing structures with its customers under which it charges interest. CFC originates loans and acquires loan portfolios that are secured by precious metal bullion and numismatic material owned by the borrowers and held by the Company for the term of the loan. Also, the Company offers a number of secured financing options to its customers to finance their precious metals purchases including consignments and other structured inventory finance products whereby the Company earns a fee based on the underlying value of the precious metal ("repurchase arrangements with customers").
Interest Expense. The Company incurs interest expense associated with its lines of credit, notes payable, product financing agreements for the transfer and subsequent re-acquisition of gold, silver, and platinum at a fixed price with a third-party finance company ("product financing arrangements"), and short-term precious metal borrowing arrangements with our suppliers ("liabilities on borrowed metals" and "precious metals leases").
Performance Metrics
In addition to financial statement indicators, management also utilizes key operational metrics to assess the performance of our business. Monex's performance metrics have been included in our consolidated financial results as of January 2, 2026 and SMI's performance metrics have been included in our consolidated financial results as of April 1, 2026.
Gold and Silver Ounces Sold and Delivered to Customers. A key performance metric we utilize is the number of ounces of gold and silver sold and delivered to our customers (excluding ounces recorded on forward contracts). These metrics reflect our business volume without regard to changes in commodity pricing, which also impacts revenue, but can mask actual business trends.
The primary purpose of entering into forward sales transactions is to hedge commodity price risk. Although the revenues realized from these forward sales transactions are often significant, they generally have negligible impact on gross margins. As a result, the Company excludes the ounces recorded on forward contracts from its performance metrics, as the Company does not enter into forward sales transactions for speculative purposes.
Wholesale Sales Ticket Volume. Another measure of our business that is unaffected by changes in commodity pricing is ticket volume (or number of orders processed). Ticket volume for the Wholesale Sales & Ancillary Services segment measures the total number of wholesale orders processed during the period. In periods of higher volatility, there is generally increased trading in the commodity markets, causing increased demand for our products, resulting in higher business volume. During periods of heightened demand, order size per ticket may increase.
Direct-to-Consumer Customers. We are focused on attracting new customers and retaining existing customers to drive revenue growth. We use the following three metrics as revenue growth indicators when assessing our customer base:
42
Direct-to-Consumer Ticket Volume. Ticket volume for the Direct-to-Consumer segment measures the number of product orders processed during the period. In periods of higher volatility, there is generally increased consumer demand for our products, resulting in higher business volume. We use the following three metrics indicators when assessing our ticket volume:
Average Order Value. Average order value for the Direct-to-Consumer segment and JMB measures the average dollar value of product orders (excluding accumulation program orders) delivered to the customer during the period.
Inventory Turnover. Inventory turnover is another performance measure on which we are focused and is calculated as the cost of sales divided by the average inventory during the relevant period. Inventory turnover is a measure of how quickly inventory has moved during the period. A higher inventory turnover ratio, which we typically experience during periods of higher volatility when trading is more robust, typically reflects a more efficient use of our capital.
The period of time that inventory is held by the Company varies depending upon the nature of our inventory commitments with customers and suppliers. See Note 6 to the Company's consolidated financial statements for a description of our classifications of inventory by type. When management analyzes inventory turnover on a period over period basis, consideration is given to each inventory type and its corresponding impact on the inventory turnover calculation. For example:
Additionally, our inventory turnover ratio can be affected by hedging activity, as the period over period change of the inventory turnover ratio may be significantly impacted by a period over period change in hedging volume. For example, if trading activity were to remain constant over two periods, but there were significantly higher forward sales in the current period compared to a prior period, the calculated inventory turnover ratio would increase notwithstanding the constancy of the trading volume.
Number of Secured Loans. Finally, as a measure of the size of our Secured Lending segment, we utilize the number of outstanding secured loans to customers that are primarily collateralized by precious metals at the end of each quarter.
The Company calculates a loan-to-value ("LTV") ratio for each loan as the principal amount of the loan divided by the liquidation value of the collateral, which is based on daily spot market prices of precious metal bullion. When the market price of the pledged collateral decreases and thereby increases the LTV ratio of a loan above a prescribed maximum ratio, usually 85%, the Company has the option to make a margin call on the loan. As a result, a decline of precious metal market prices may cause a decrease in the number of loans outstanding in a period.
Non-GAAP Measures
In addition to key operational metrics that are used to assess the performance of our business, management also uses non-GAAP financial performance and liquidity measures. We believe "adjusted net income before provision for income taxes” and "EBITDA" can provide useful information to evaluate our financial performance and liquidity position. Non-GAAP measures do not have standardized definitions and should not be a substitute for measures that are prepared in accordance with U.S. GAAP. For a reconciliation of these non-GAAP measures to the most directly comparable U.S. GAAP measure reported in our consolidated statements of income and consolidated statements of cash flows and a discussion of certain limitations inherent in such measures, refer to the “Non-GAAP Measures” section below.
Fiscal Year
Our fiscal year end is June 30 each year.
43
Macroeconomic Volatility
Macroeconomic uncertainty and the volatility in the financial markets in recent years have positively affected the Company’s trading revenues and gross profit as the volatility of the price of precious metals and numismatics typically results in an increase in the spread between bid and ask prices on these products. Although conditions may fluctuate from period to period, when volatility is high, we historically experience increased demand for products in each of our coin and bar, industrial, and retail businesses. While macroeconomic uncertainty continues to impact our business, its effects have been less pronounced in the current and prior fiscal year. The Company cannot predict the periods during which increased volatility will occur or the level of increased volatility, the effect of volatility and macroeconomic uncertainty on the Company, or whether other effects on the Company and its businesses will materialize in the short or long term.
44
RESULTS OF OPERATIONS
Overview of Results of Operations
Consolidated Results of Operations for the Years Ended June 30, 2026 and 2025
The operating results of our business were as follows (in thousands, except per share and performance metrics data):
|
|
|
|
|
|
|
|
|
|
|
|
||||||||||||||||||
Year Ended June 30, |
|
2026 |
|
|
|
2025 |
|
|
|
Change |
|
||||||||||||||||||
|
|
$ |
|
|
|
% of revenue |
|
|
|
$ |
|
|
|
% of revenue |
|
|
|
$ |
|
|
|
% |
|
||||||
Revenues |
|
$ |
25,513,409 |
|
|
|
|
100.000 |
% |
|
|
$ |
10,978,614 |
|
|
|
|
100.000 |
% |
|
|
$ |
14,534,795 |
|
|
|
|
132.4 |
% |
Gross profit |
|
|
453,144 |
|
|
|
|
1.776 |
% |
|
|
|
210,916 |
|
|
|
|
1.921 |
% |
|
|
$ |
242,228 |
|
|
|
|
114.8 |
% |
Selling, general, and administrative expenses |
|
|
(275,582 |
) |
|
|
|
(1.080 |
%) |
|
|
|
(139,193 |
) |
|
|
|
(1.268 |
%) |
|
|
$ |
136,389 |
|
|
|
|
98.0 |
% |
Depreciation and amortization expense |
|
|
(34,752 |
) |
|
|
|
(0.136 |
%) |
|
|
|
(22,920 |
) |
|
|
|
(0.209 |
%) |
|
|
$ |
11,832 |
|
|
|
|
51.6 |
% |
Interest income |
|
|
25,634 |
|
|
|
|
0.100 |
% |
|
|
|
25,948 |
|
|
|
|
0.236 |
% |
|
|
$ |
(314 |
) |
|
|
|
(1.2 |
%) |
Interest expense |
|
|
(61,110 |
) |
|
|
|
(0.240 |
%) |
|
|
|
(46,203 |
) |
|
|
|
(0.421 |
%) |
|
|
$ |
14,907 |
|
|
|
|
32.3 |
% |
Earnings (losses) from equity method investments |
|
|
4,391 |
|
|
|
|
0.017 |
% |
|
|
|
(2,825 |
) |
|
|
|
(0.026 |
%) |
|
|
$ |
7,216 |
|
|
|
|
255.4 |
% |
Other (expense) income, net |
|
|
(1,927 |
) |
|
|
|
(0.008 |
%) |
|
|
|
2,031 |
|
|
|
|
0.018 |
% |
|
|
$ |
(3,958 |
) |
|
|
|
(194.9 |
%) |
Remeasurement gain (loss) on pre-existing equity interests |
|
|
4,136 |
|
|
|
|
0.016 |
% |
|
|
|
(5,143 |
) |
|
|
|
(0.047 |
%) |
|
|
$ |
9,279 |
|
|
|
|
180.4 |
% |
Losses on foreign exchange |
|
|
(4,412 |
) |
|
|
|
(0.017 |
%) |
|
|
|
(1,341 |
) |
|
|
|
(0.012 |
%) |
|
|
$ |
3,071 |
|
|
|
|
229.0 |
% |
Net income before provision for income taxes |
|
|
109,522 |
|
|
|
|
0.429 |
% |
|
|
|
21,270 |
|
|
|
|
0.194 |
% |
|
|
$ |
88,252 |
|
|
|
|
414.9 |
% |
Income tax expense |
|
|
(20,907 |
) |
|
|
|
(0.082 |
%) |
|
|
|
(5,426 |
) |
|
|
|
(0.049 |
%) |
|
|
$ |
15,481 |
|
|
|
|
285.3 |
% |
Net income |
|
|
88,615 |
|
|
|
|
0.347 |
% |
|
|
|
15,844 |
|
|
|
|
0.144 |
% |
|
|
$ |
72,771 |
|
|
|
|
459.3 |
% |
Net income (loss) attributable to noncontrolling interests |
|
|
6,274 |
|
|
|
|
0.025 |
% |
|
|
|
(1,476 |
) |
|
|
|
(0.013 |
%) |
|
|
$ |
7,750 |
|
|
|
|
525.1 |
% |
Net income attributable to the Company |
|
$ |
82,341 |
|
|
|
|
0.323 |
% |
|
|
$ |
17,320 |
|
|
|
|
0.158 |
% |
|
|
$ |
65,021 |
|
|
|
|
375.4 |
% |
|
|
|
|
|
|
|
|
|
|
|
|
|
|
|
|
|
|
|
|
|
|
|
|
||||||
Basic and diluted net income per share attributable |
|
|
|
|
|
|
|
|
|
|
|
|
|
|
|
|
|
|
|
|
|
||||||||
|
|
|
|
|
|
|
|
|
|
|
|
|
|
|
|
|
|
|
|
|
|
|
|
||||||
Per Share Data: |
|
|
|
|
|
|
|
|
|
|
|
|
|
|
|
|
|
|
|
|
|
|
|
||||||
Basic |
|
$ |
3.11 |
|
|
|
|
|
|
|
$ |
0.73 |
|
|
|
|
|
|
|
$ |
2.38 |
|
|
|
|
326.0 |
% |
||
Diluted |
|
$ |
3.02 |
|
|
|
|
|
|
|
$ |
0.71 |
|
|
|
|
|
|
|
$ |
2.31 |
|
|
|
|
325.4 |
% |
||
|
|
|
|
|
|
|
|
|
|
|
|
|
|
|
|
|
|
|
|
|
|
|
|
||||||
Performance Metrics:(1) |
|
|
|
|
|
|
|
|
|
|
|
|
|
|
|
|
|
|
|
|
|
|
|
||||||
Gold ounces sold |
|
|
2,032,000 |
|
|
|
|
|
|
|
|
1,642,000 |
|
|
|
|
|
|
|
|
390,000 |
|
|
|
|
23.8 |
% |
||
Silver ounces sold |
|
|
73,563,500 |
|
|
|
|
|
|
|
|
73,643,000 |
|
|
|
|
|
|
|
|
(79,500 |
) |
|
|
|
(0.1 |
%) |
||
Inventory turnover ratio |
|
|
13.8 |
|
|
|
|
|
|
|
|
9.1 |
|
|
|
|
|
|
|
|
4.7 |
|
|
|
|
51.6 |
% |
||
Number of secured loans at period end |
|
|
367 |
|
|
|
|
|
|
|
|
445 |
|
|
|
|
|
|
|
|
(78 |
) |
|
|
|
(17.5 |
%) |
||
45
Revenues
in thousands, except performance metrics |
|
|
|
|
|
|
|
|
|
|
|
|
|
|
|
|
|
|
|
|
|
||||||||
Year Ended June 30, |
|
2026 |
|
|
|
2025 |
|
|
|
Change |
|
||||||||||||||||||
|
|
$ |
|
|
|
% of revenue |
|
|
|
$ |
|
|
|
% of revenue |
|
|
|
$ |
|
|
|
% |
|
||||||
Revenues |
|
$ |
25,513,409 |
|
|
|
|
100.000 |
% |
|
|
$ |
10,978,614 |
|
|
|
|
100.000 |
% |
|
|
$ |
14,534,795 |
|
|
|
|
132.4 |
% |
Performance Metrics |
|
|
|
|
|
|
|
|
|
|
|
|
|
|
|
|
|
|
|
|
|
|
|
||||||
Gold ounces sold |
|
|
2,032,000 |
|
|
|
|
|
|
|
|
1,642,000 |
|
|
|
|
|
|
|
|
390,000 |
|
|
|
|
23.8 |
% |
||
Silver ounces sold |
|
|
73,563,500 |
|
|
|
|
|
|
|
|
73,643,000 |
|
|
|
|
|
|
|
|
(79,500 |
) |
|
|
|
(0.1 |
%) |
||
Revenues for the year ended June 30, 2026 increased $14.535 billion, or 132.4%, to $25.513 billion from $10.979 billion in 2025. Excluding an increase of $8.323 billion of forward sales, our revenues increased $6.212 billion, or 94.8%, which was due to higher average selling prices of gold and silver as well as an increase in gold ounces sold, partially offset by a decrease in silver ounces sold. Revenues also increased due to the acquisitions of SGI and Pinehurst in February 2025, AMS in April 2025, Monex in January 2026, and SMI in April 2026, whose results were not included, or were not fully included in the same year-ago period.
Gold ounces sold for the year ended June 30, 2026 increased 390,000 ounces, or 23.8%, to 2,032,000 ounces from 1,642,000 ounces in 2025. Silver ounces sold for the year ended June 30, 2026 decreased 79,500 ounces, or 0.1%, to 73,563,500 ounces from 73,643,000 ounces in 2025. On average, selling prices for gold increased by 51.1% and selling prices for silver increased by 112.5% during the year ended June 30, 2026 as compared to the prior year.
Gross Profit
in thousands, except performance metric |
|
|
|
|
|
|
|
|
|
|
|
|
|
|
|
|
|
|
|
|
|
||||||||
Year Ended June 30, |
|
2026 |
|
|
|
2025 |
|
|
|
Change |
|
||||||||||||||||||
|
|
$ |
|
|
|
% of revenue |
|
|
|
$ |
|
|
|
% of revenue |
|
|
|
$ |
|
|
|
% |
|
||||||
Gross profit |
|
$ |
453,144 |
|
|
|
|
1.776 |
% |
|
|
$ |
210,916 |
|
|
|
|
1.921 |
% |
|
|
$ |
242,228 |
|
|
|
|
114.8 |
% |
Performance Metric |
|
|
|
|
|
|
|
|
|
|
|
|
|
|
|
|
|
|
|
|
|
|
|
||||||
Inventory turnover ratio |
|
|
13.8 |
|
|
|
|
|
|
|
|
9.1 |
|
|
|
|
|
|
|
|
4.7 |
|
|
|
|
51.6 |
% |
||
Gross profit for the year ended June 30, 2026 increased $242.2 million, or 114.8%, to $453.1 million from $210.9 million in 2025. The overall gross profit increase was due to an increase in gross profits earned by both the Wholesale Sales & Ancillary Services segment and the Direct-to-Consumer segment, including the acquisitions of SGI, Pinehurst, AMS, Monex, and SMI, whose results were not included or were not fully included in the same year-ago period.
The Company’s overall gross margin percentage for the year ended June 30, 2026 decreased by 14.5 basis points to 1.776% from 1.921% in 2025. Excluding forward sales that had a negligible impact on the amount of gross profit, our gross margin percentage for the year ended June 30, 2026 increased by 33.1 basis points to 3.550% from 3.219%, which was primarily due to an increase in our retail market activity and wider premium spreads, partially offset by lower trading profits.
Our inventory turnover ratio for the year ended June 30, 2026 increased by 51.6% to 13.8 from 9.1 in 2025. The increase in our inventory turnover ratio was primarily due to higher revenue, including higher forward sales, partially offset by higher average inventory balances.
Selling, General and Administrative Expense
in thousands |
|
|
|
|
|
|
|
|
|
|
|
|
|
|
|
|
|
|
|
|
|
|
|
||||||
Year Ended June 30, |
|
2026 |
|
|
|
2025 |
|
|
|
Change |
|
||||||||||||||||||
|
|
$ |
|
|
|
% of revenue |
|
|
|
$ |
|
|
|
% of revenue |
|
|
|
$ |
|
|
|
% |
|
||||||
Selling, general, and administrative expenses |
|
$ |
(275,582 |
) |
|
|
|
(1.080 |
%) |
|
|
$ |
(139,193 |
) |
|
|
|
(1.268 |
%) |
|
|
$ |
136,389 |
|
|
|
|
98.0 |
% |
Selling, general, and administrative expenses for the year ended June 30, 2026 increased $136.4 million, or 98.0%, to $275.6 million from $139.2 million in 2025. The change was primarily due to: (i) an increase in compensation expense of $85.8 million, (ii) higher advertising costs of $20.4 million, (iii) an increase in insurance costs of $8.7 million, (iv) an increase in consulting and professional fees of $7.4 million, (v) an increase in bank service and credit card fees of $4.7 million, and (vi) an increase in facilities expense of $4.3 million. Selling, general and administrative expenses for the year ended June 30, 2026 included $104.3 million of expenses incurred by SGI, Pinehurst, AMS, Monex, and SMI, whose results were not included, or were not fully included in the same year-ago period. Excluding the increase from newly acquired subsidiaries, our selling, general and administrative expenses increased $32.1 million from the prior year period.
46
Depreciation and Amortization Expense
in thousands |
|
|
|
|
|
|
|
|
|
|
|
|
|
|
|
|
|
|
|
|
|
|
|
||||||
Year Ended June 30, |
|
2026 |
|
|
|
2025 |
|
|
|
Change |
|
||||||||||||||||||
|
|
$ |
|
|
|
% of revenue |
|
|
|
$ |
|
|
|
% of revenue |
|
|
|
$ |
|
|
|
% |
|
||||||
Depreciation and amortization expense |
|
$ |
(34,752 |
) |
|
|
|
(0.136 |
%) |
|
|
$ |
(22,920 |
) |
|
|
|
(0.209 |
%) |
|
|
$ |
11,832 |
|
|
|
|
51.6 |
% |
Depreciation and amortization expense for the year ended June 30, 2026 increased $11.8 million, or 51.6%, to $34.8 million from $22.9 million in 2025 primarily due to (i) an increase in amortization expense of $11.6 million relating to an increase in intangible asset amortization from intangible assets acquired through our acquisitions of SGI, Pinehurst, AMS, Monex, and SMI, and (ii) an increase in depreciation expense of $5.8 million due to an increase in capital expenditures, partially offset by (iii) a decrease of $5.6 million in JMB and SGB intangible asset amortization.
Interest Income
in thousands, except performance metric |
|
|
|
|
|
|
|
|
|
|
|
|
|
|
|
|
|
|
|
|
|
|
|
||||||
Year Ended June 30, |
|
2026 |
|
|
|
2025 |
|
|
|
Change |
|
||||||||||||||||||
|
|
$ |
|
|
|
% of revenue |
|
|
|
$ |
|
|
|
% of revenue |
|
|
|
$ |
|
|
|
% |
|
||||||
Interest income |
|
$ |
25,634 |
|
|
|
|
0.100 |
% |
|
|
$ |
25,948 |
|
|
|
|
0.236 |
% |
|
|
$ |
(314 |
) |
|
|
|
(1.2 |
%) |
Performance Metric |
|
|
|
|
|
|
|
|
|
|
|
|
|
|
|
|
|
|
|
|
|
|
|
||||||
Number of secured loans at period-end |
|
|
367 |
|
|
|
|
|
|
|
|
445 |
|
|
|
|
|
|
|
|
(78 |
) |
|
|
|
(17.5 |
%) |
||
Interest income for the year ended June 30, 2026 decreased $0.3 million, or 1.2%, to $25.6 million from $25.9 million in 2025. The aggregate decrease in interest income was due to a decrease in interest earned of $2.4 million by our Wholesale Sales & Ancillary Services segment, partially offset by an increase in interest income earned by our Secured Lending segment of $1.0 million and an increase in interest income earned by our DTC segment of $1.1 million.
Interest Expense
in thousands |
|
|
|
|
|
|
|
|
|
|
|
|
|
|
|
|
|
|
|
|
|
|
|
||||||
Year Ended June 30, |
|
2026 |
|
|
|
2025 |
|
|
|
Change |
|
||||||||||||||||||
|
|
$ |
|
|
|
% of revenue |
|
|
|
$ |
|
|
|
% of revenue |
|
|
|
$ |
|
|
|
% |
|
||||||
Interest expense |
|
$ |
(61,110 |
) |
|
|
|
(0.240 |
%) |
|
|
$ |
(46,203 |
) |
|
|
|
(0.421 |
%) |
|
|
$ |
14,907 |
|
|
|
|
32.3 |
% |
Interest expense for the year ended June 30, 2026 increased $14.9 million, or 32.3%, to $61.1 million from $46.2 million in 2025. The increase in interest expense was primarily due to: (i) an increase of $11.0 million related to precious metals leases driven by higher overall borrowings, partially offset by a decrease in interest rates, and (ii) higher interest and fees of $8.0 million related to product financing arrangements due to higher interest rates and fees, partially offset by (iii) a decrease of $5.4 million associated with our Trading Credit Facility due to reduced borrowings.
Earnings (Losses) from Equity Method Investments
in thousands |
|
|
|
|
|
|
|
|
|
|
|
|
|
|
|
|
|
|
|
|
|
|
|
||||||
Year Ended June 30, |
|
2026 |
|
|
|
2025 |
|
|
|
Change |
|
||||||||||||||||||
|
|
$ |
|
|
|
% of revenue |
|
|
|
$ |
|
|
|
% of revenue |
|
|
|
$ |
|
|
|
% |
|
||||||
Earnings (losses) from equity method investments |
|
$ |
4,391 |
|
|
|
|
0.017 |
% |
|
|
$ |
(2,825 |
) |
|
|
|
(0.026 |
%) |
|
|
$ |
7,216 |
|
|
|
|
255.4 |
% |
Earnings (losses) from equity method investments for the year ended June 30, 2026 increased $7.2 million, or 255.4%, to earnings of $4.4 million from a loss of $2.8 million in 2025 due to increased earnings of our equity method investees.
47
Other Income and Expense, Net
in thousands |
|
|
|
|
|
|
|
|
|
|
|
|
|
|
|
|
|
|
|
|
|
|
|
||||||
Year Ended June 30, |
|
2026 |
|
|
|
2025 |
|
|
|
Change |
|
||||||||||||||||||
|
|
$ |
|
|
|
% of revenue |
|
|
|
$ |
|
|
|
% of revenue |
|
|
|
$ |
|
|
|
% |
|
||||||
Other (expense) income, net |
|
$ |
(1,927 |
) |
|
|
|
(0.008 |
%) |
|
|
$ |
2,031 |
|
|
|
|
0.018 |
% |
|
|
$ |
(3,958 |
) |
|
|
|
(194.9 |
%) |
Other income and expense, net for the year ended June 30, 2026 decreased $4.0 million, or 194.9%, to expense of $1.9 million from income of $2.0 million in 2025. The change in other income and expense, net was primarily due to a $3.0 million unrealized loss on our holdings of XAU₮ stablecoin.
Remeasurement Gain (Loss) on Pre-Existing Equity Interests
in thousands |
|
|
|
|
|
|
|
|
|
|
|
|
|
|
|
|
|
|
|
|
|
|
|
||||||
Year Ended June 30, |
|
2026 |
|
|
|
2025 |
|
|
|
Change |
|
||||||||||||||||||
|
|
$ |
|
|
|
% of revenue |
|
|
|
$ |
|
|
|
% of revenue |
|
|
|
$ |
|
|
|
% |
|
||||||
Remeasurement gain (loss) on pre-existing equity interests |
|
$ |
4,136 |
|
|
|
|
0.016 |
% |
|
|
$ |
(5,143 |
) |
|
|
|
(0.047 |
%) |
|
|
$ |
9,279 |
|
|
|
|
180.4 |
% |
The Company incurred remeasurement gains and losses on our pre-existing equity interests related to our acquisitions of Pinehurst in February 2025, AMS in April 2025, and SMI in April 2026. See further details in Note 1.
Gains and Losses on Foreign Exchange
in thousands |
|
|
|
|
|
|
|
|
|
|
|
|
|
|
|
|
|
|
|
|
|
|
|
||||||
Year Ended June 30, |
|
2026 |
|
|
|
2025 |
|
|
|
Change |
|
||||||||||||||||||
|
|
$ |
|
|
|
% of revenue |
|
|
|
$ |
|
|
|
% of revenue |
|
|
|
$ |
|
|
|
% |
|
||||||
Losses on foreign exchange |
|
$ |
(4,412 |
) |
|
|
|
(0.017 |
%) |
|
|
$ |
(1,341 |
) |
|
|
|
(0.012 |
%) |
|
|
$ |
3,071 |
|
|
|
|
229.0 |
% |
Losses on foreign exchange for the year ended June 30, 2026 increased $3.1 million, or 229.0%, to $4.4 million from $1.3 million in 2025. The change in our gains and losses on foreign exchange was primarily due to increased sales in Canada.
Income Tax Expense
in thousands |
|
|
|
|
|
|
|
|
|
|
|
|
|
|
|
|
|
|
|
|
|
|
|
||||||
Year Ended June 30, |
|
2026 |
|
|
|
2025 |
|
|
|
Change |
|
||||||||||||||||||
|
|
$ |
|
|
|
% of revenue |
|
|
|
$ |
|
|
|
% of revenue |
|
|
|
$ |
|
|
|
% |
|
||||||
Income tax expense |
|
$ |
(20,907 |
) |
|
|
|
(0.082 |
%) |
|
|
$ |
(5,426 |
) |
|
|
|
(0.049 |
%) |
|
|
$ |
15,481 |
|
|
|
|
285.3 |
% |
Our income tax expense was $20.9 million and $5.4 million for the years ended June 30, 2026 and 2025. Our effective tax rate was approximately 19.1% and 25.5% for the years ended June 30, 2026 and 2025, respectively, primarily due to the effects of state and local income taxes, net of federal tax benefit, excess tax benefit from share-based compensation, acquisition-related adjustments, and other permanent differences. Fiscal 2026 included foreign tax credits, foreign tax effects related principally to our Hong Kong operations, and tax effects of entity reorganization. Fiscal 2025 included one-time tax effects related to the Company's acquisitions of Pinehurst and AMS and related transaction costs.
48
SEGMENT RESULTS OF OPERATIONS
The Company conducts its operations in three reportable segments: (i) Wholesale Sales & Ancillary Services, (ii) Direct-to-Consumer, and (iii) Secured Lending.
Results of Operations — Wholesale Sales & Ancillary Services Segment
The Company operates its Wholesale Sales & Ancillary Services segment directly under the "A-Mark" brand and through its consolidated subsidiaries, A-Mark Trading AG (“AMTAG”), Transcontinental Depository Services ("TDS"), A-M Global Logistics, LLC (“AMGL” or "Logistics"), AM&ST Associates, LLC ("AMST" or the "Silver Towne Mint"), AM/LPM Ventures, LLC, which owns a majority interest in LPM Group Limited ("LPM"), Spectrum Group International, LLC, which was formed in February 2025 to acquire all of the stock of Spectrum Group International, Inc. ("SGI"), Pinehurst Coin Exchange, Inc. ("Pinehurst"), AM Precious Metals Singapore PTE, Ltd., and Sunshine Minting, Inc. ("SMI"). The Wholesale Sales & Ancillary Services segment includes the consolidating eliminations of inter-segment transactions and unallocated segment adjustments.
Overview of Results of Operations for the Years Ended June 30, 2026 and 2025
— Wholesale Sales & Ancillary Services Segment
The operating results of our Wholesale Sales & Ancillary Services segment were as follows (in thousands, except performance metrics data):
Year Ended June 30, |
|
2026 |
|
2025 |
|
Change |
|
||||||||||||||||||||||
|
|
$ |
|
|
|
% of revenue |
|
|
|
$ |
|
|
|
% of revenue |
|
|
|
$ |
|
|
|
% |
|
||||||
Revenues |
|
$ |
19,415,193 |
|
(a) |
|
|
100.000 |
% |
|
|
$ |
8,695,357 |
|
(a) |
|
|
100.000 |
% |
|
|
$ |
10,719,836 |
|
|
|
|
123.3 |
% |
Gross profit |
|
|
139,794 |
|
|
|
|
0.720 |
% |
|
|
|
85,875 |
|
|
|
|
0.988 |
% |
|
|
$ |
53,919 |
|
|
|
|
62.8 |
% |
Selling, general, and administrative expenses |
|
|
(104,023 |
) |
|
|
|
(0.536 |
%) |
|
|
|
(59,019 |
) |
|
|
|
(0.679 |
%) |
|
|
$ |
45,004 |
|
|
|
|
76.3 |
% |
Depreciation and amortization expense |
|
|
(7,310 |
) |
|
|
|
(0.038 |
%) |
|
|
|
(3,909 |
) |
|
|
|
(0.045 |
%) |
|
|
$ |
3,401 |
|
|
|
|
87.0 |
% |
Interest income |
|
|
12,702 |
|
|
|
|
0.065 |
% |
|
|
|
15,134 |
|
|
|
|
0.174 |
% |
|
|
$ |
(2,432 |
) |
|
|
|
(16.1 |
%) |
Interest expense |
|
|
(46,113 |
) |
|
|
|
(0.238 |
%) |
|
|
|
(37,709 |
) |
|
|
|
(0.434 |
%) |
|
|
$ |
8,404 |
|
|
|
|
22.3 |
% |
Earnings (losses) from equity method investments |
|
|
4,258 |
|
|
|
|
0.022 |
% |
|
|
|
(2,982 |
) |
|
|
|
(0.034 |
%) |
|
|
$ |
7,240 |
|
|
|
|
242.8 |
% |
Other (expense) income, net |
|
|
(9,542 |
) |
|
|
|
(0.049 |
%) |
|
|
|
1,299 |
|
|
|
|
0.015 |
% |
|
|
$ |
(10,841 |
) |
|
|
|
(834.6 |
%) |
Remeasurement gain (loss) on pre-existing equity interests |
|
|
4,136 |
|
|
|
|
0.021 |
% |
|
|
|
(5,143 |
) |
|
|
|
(0.059 |
%) |
|
|
$ |
9,279 |
|
|
|
|
180.4 |
% |
Gains (losses) on foreign exchange |
|
|
61 |
|
|
|
|
0.000 |
% |
|
|
|
(806 |
) |
|
|
|
(0.009 |
%) |
|
|
$ |
867 |
|
|
|
|
107.6 |
% |
Net loss before provision for income taxes |
|
$ |
(6,037 |
) |
|
|
|
(0.031 |
%) |
|
|
$ |
(7,260 |
) |
|
|
|
(0.083 |
%) |
|
|
$ |
(1,223 |
) |
|
|
|
(16.8 |
%) |
|
|
|
|
|
|
|
|
|
|
|
|
|
|
|
|
|
|
|
|
|
|
|
|
||||||
Performance Metrics: |
|
|
|
|
|
|
|
|
|
|
|
|
|
|
|
|
|
|
|
|
|
|
|
||||||
Gold ounces sold |
|
|
1,154,000 |
|
|
|
|
|
|
|
|
1,145,000 |
|
|
|
|
|
|
|
|
9,000 |
|
|
|
|
0.8 |
% |
||
Silver ounces sold |
|
|
44,955,500 |
|
|
|
|
|
|
|
|
56,611,000 |
|
|
|
|
|
|
|
|
(11,655,500 |
) |
|
|
|
(20.6 |
%) |
||
Wholesale Sales ticket volume |
|
|
148,800 |
|
|
|
|
|
|
|
|
130,606 |
|
|
|
|
|
|
|
|
18,194 |
|
|
|
|
13.9 |
% |
||
Revenues — Wholesale Sales & Ancillary Services
in thousands, except performance metrics |
|
|
|
|
|
|
|
|
|
|
|
|
|
|
|
|
|
|
|
|
|
||||||||
Year Ended June 30, |
|
2026 |
|
2025 |
|
Change |
|
||||||||||||||||||||||
|
|
$ |
|
|
|
% of revenue |
|
|
|
$ |
|
|
|
% of revenue |
|
|
|
$ |
|
|
|
% |
|
||||||
Revenues |
|
$ |
19,415,193 |
|
(a) |
|
|
100.000 |
% |
|
|
$ |
8,695,357 |
|
(a) |
|
|
100.000 |
% |
|
|
$ |
10,719,836 |
|
|
|
|
123.3 |
% |
Performance Metrics |
|
|
|
|
|
|
|
|
|
|
|
|
|
|
|
|
|
|
|
|
|
|
|
||||||
Gold ounces sold |
|
|
1,154,000 |
|
|
|
|
|
|
|
|
1,145,000 |
|
|
|
|
|
|
|
|
9,000 |
|
|
|
|
0.8 |
% |
||
Silver ounces sold |
|
|
44,955,500 |
|
|
|
|
|
|
|
|
56,611,000 |
|
|
|
|
|
|
|
|
(11,655,500 |
) |
|
|
|
(20.6 |
%) |
||
Wholesale Sales ticket volume |
|
|
148,800 |
|
|
|
|
|
|
|
|
130,606 |
|
|
|
|
|
|
|
|
18,194 |
|
|
|
|
13.9 |
% |
||
Revenues for the year ended June 30, 2026 increased $10.720 billion, or 123.3%, to $19.415 billion from $8.695 billion in 2025. Excluding an increase in forward sales of $8.323 billion, our revenues increased $2.397 billion, which was due to higher average selling prices of gold and silver and an increase in gold ounces sold, partially offset by a decrease in silver ounces sold. Revenues also increased due to the acquisitions of SGI and Pinehurst in February 2025 and SMI in April 2026, whose results were not included, or were not fully included in the same year-ago period.
49
Gold ounces sold for the year ended June 30, 2026 increased 9,000 ounces, or 0.8%, to 1,154,000 ounces from 1,145,000 ounces in 2025. Silver ounces sold for the year ended June 30, 2026 decreased 11,655,500 ounces, or 20.6%, to 44,955,500 ounces from 56,611,000 ounces in 2025. On average, selling prices for gold increased by 52.4% and selling prices for silver increased by 107.4% during the year ended June 30, 2026 as compared to the prior year.
The Wholesale Sales ticket volume for the year ended June 30, 2026 increased by 18,194 tickets, or 13.9% to 148,800 tickets from 130,606 tickets in 2025.
Gross Profit — Wholesale Sales & Ancillary Services
in thousands |
|
|
|
|
|
|
|
|
|
|
|
|
|
|
|
|
|
|
|
|
|
||||||||
Year Ended June 30, |
|
2026 |
|
2025 |
|
Change |
|
||||||||||||||||||||||
|
|
$ |
|
|
|
% of revenue |
|
|
|
$ |
|
|
|
% of revenue |
|
|
|
$ |
|
|
|
% |
|
||||||
Gross profit |
|
$ |
139,794 |
|
|
|
|
0.720 |
% |
|
|
$ |
85,875 |
|
|
|
|
0.988 |
% |
|
|
$ |
53,919 |
|
|
|
|
62.8 |
% |
Gross profit for the year ended June 30, 2026 increased $53.9 million, or 62.8%, to $139.8 million from $85.9 million in 2025. The gross profit increase was primarily due to wider premium spreads, partially offset by lower trading profits. Gross profit also increased due to the acquisitions of SGI and Pinehurst in February 2025 and SMI in April 2026, whose results were not included, or were not fully included in the same year-ago period.
This segment’s profit margin percentage decreased by 26.8 basis points to 0.720% from 0.988% in 2025. The decrease in gross margin percentage was mainly attributable to the impact of increased forward sales and lower trading profits, partially offset by wider premium spreads.
Excluding forward sales that had a negligible impact on the amount of gross profit, this segment's gross margin percentage for the year ended June 30, 2026 increased by 8.5 basis points to 2.097% from 2.012% in the prior year. Forward sales increase revenues but are associated with negligible gross profit. The Company enters into forward contracts to hedge its precious metals price risk exposure and not for speculative purposes.
Selling, General and Administrative Expenses — Wholesale Sales & Ancillary Services
in thousands |
|
|
|
|
|
|
|
|
|
|
|
|
|
|
|
|
|
|
|
|
|
|
|
||||||
Year Ended June 30, |
|
2026 |
|
2025 |
|
Change |
|
||||||||||||||||||||||
|
|
$ |
|
|
|
% of revenue |
|
|
|
$ |
|
|
|
% of revenue |
|
|
|
$ |
|
|
|
% |
|
||||||
Selling, general, and administrative expenses |
|
$ |
(104,023 |
) |
|
|
|
(0.536 |
%) |
|
|
$ |
(59,019 |
) |
|
|
|
(0.679 |
%) |
|
|
$ |
45,004 |
|
|
|
|
76.3 |
% |
Selling, general, and administrative expenses for the year ended June 30, 2026 increased $45.0 million, or 76.3%, to $104.0 million from $59.0 million in 2025. The change was primarily due to: (i) an increase in compensation expense of $29.8 million, (ii) an increase in insurance costs of $6.2 million, (iii) higher advertising costs of $4.5 million, (iv) an increase in facilities expense of $1.8 million, and (v) an increase bank service and credit card fees of $0.3 million. Selling, general and administrative expenses for the year ended June 30, 2026 included $21.6 million of expenses incurred by SGI, Pinehurst, and SMI, whose results were not included, or were not fully included in the same year-ago period. Excluding the increase from newly acquired subsidiaries, our selling, general and administrative expenses increased $23.4 million from the prior year period.
Depreciation and Amortization Expense — Wholesale Sales & Ancillary Services
in thousands |
|
|
|
|
|
|
|
|
|
|
|
|
|
|
|
|
|
|
|
|
|
|
|
||||||
Year Ended June 30, |
|
2026 |
|
2025 |
|
Change |
|
||||||||||||||||||||||
|
|
$ |
|
|
|
% of revenue |
|
|
|
$ |
|
|
|
% of revenue |
|
|
|
$ |
|
|
|
% |
|
||||||
Depreciation and amortization expense |
|
$ |
(7,310 |
) |
|
|
|
(0.038 |
%) |
|
|
$ |
(3,909 |
) |
|
|
|
(0.045 |
%) |
|
|
$ |
3,401 |
|
|
|
|
87.0 |
% |
Depreciation and amortization expense for the year ended June 30, 2026 increased $3.4 million, or 87.0%, to $7.3 million from $3.9 million in 2025 primarily due to an increase in depreciation expense due to an increase in capital expenditures.
Interest Income — Wholesale Sales & Ancillary Services
in thousands |
|
|
|
|
|
|
|
|
|
|
|
|
|
|
|
|
|
|
|
|
|
|
|
||||||
Year Ended June 30, |
|
2026 |
|
2025 |
|
Change |
|
||||||||||||||||||||||
|
|
$ |
|
|
|
% of revenue |
|
|
|
$ |
|
|
|
% of revenue |
|
|
|
$ |
|
|
|
% |
|
||||||
Interest income |
|
$ |
12,702 |
|
|
|
|
0.065 |
% |
|
|
$ |
15,134 |
|
|
|
|
0.174 |
% |
|
|
$ |
(2,432 |
) |
|
|
|
(16.1 |
%) |
50
Interest income for the year ended June 30, 2026 decreased $2.4 million, or 16.1%, to $12.7 million from $15.1 million in 2025. The overall decrease was primarily due to: (i) a decrease in interest earned from repurchase arrangements with customers of $2.7 million, and (ii) a decrease in interest income earned from spot deferred trade orders of $2.2 million, partially offset by (iii) a $2.0 million increase in interest income earned from margin orders.
Interest Expense — Wholesale Sales & Ancillary Services
in thousands |
|
|
|
|
|
|
|
|
|
|
|
|
|
|
|
|
|
|
|
|
|
|
|
||||||
Year Ended June 30, |
|
2026 |
|
2025 |
|
Change |
|
||||||||||||||||||||||
|
|
$ |
|
|
|
% of revenue |
|
|
|
$ |
|
|
|
% of revenue |
|
|
|
$ |
|
|
|
% |
|
||||||
Interest expense |
|
$ |
(46,113 |
) |
|
|
|
(0.238 |
%) |
|
|
$ |
(37,709 |
) |
|
|
|
(0.434 |
%) |
|
|
$ |
8,404 |
|
|
|
|
22.3 |
% |
Interest expense for the year ended June 30, 2026 increased $8.4 million, or 22.3%, to $46.1 million from $37.7 million in 2025. The overall increase was primarily due to: (i) an increase of $11.0 million from precious metals leases driven by higher overall borrowings, partially offset by a decrease in interest rates, and (ii) higher interest and fees of $1.5 million related to product financing arrangements due to higher interest rates and fees, partially offset by (iii) a decrease of $5.6 million in connection with our Trading Credit Facility due to reduced borrowings.
Earnings (Losses) from Equity Method Investments— Wholesale Sales & Ancillary Services
in thousands |
|
|
|
|
|
|
|
|
|
|
|
|
|
|
|
|
|
|
|
|
|
|
|
||||||
Year Ended June 30, |
|
2026 |
|
2025 |
|
Change |
|
||||||||||||||||||||||
|
|
$ |
|
|
|
% of revenue |
|
|
|
$ |
|
|
|
% of revenue |
|
|
|
$ |
|
|
|
% |
|
||||||
Earnings (losses) from equity method investments |
|
$ |
4,258 |
|
|
|
|
0.022 |
% |
|
|
$ |
(2,982 |
) |
|
|
|
(0.034 |
%) |
|
|
$ |
7,240 |
|
|
|
|
242.8 |
% |
Earnings (losses) from equity method investments for the year ended June 30, 2026 increased $7.2 million, or 242.8%, to earnings of $4.3 million from a loss of $3.0 million in 2025 due to increased earnings of our equity method investees.
Other Income and Expense, Net - Wholesale Sales & Ancillary Services
in thousands |
|
|
|
|
|
|
|
|
|
|
|
|
|
|
|
|
|
|
|
|
|
|
|
||||||
Year Ended June 30, |
|
2026 |
|
2025 |
|
Change |
|
||||||||||||||||||||||
|
|
$ |
|
|
|
% of revenue |
|
|
|
$ |
|
|
|
% of revenue |
|
|
|
$ |
|
|
|
% |
|
||||||
Other (expense) income, net |
|
$ |
(9,542 |
) |
|
|
|
(0.049 |
%) |
|
|
$ |
1,299 |
|
|
|
|
0.015 |
% |
|
|
$ |
(10,841 |
) |
|
|
|
(834.6 |
%) |
Other income and expense, net for the year ended June 30, 2026 decreased $10.8 million, or 834.6%, to expense of $9.5 million from income of $1.3 million in 2025. The change in other income and expense, net was primarily due to an increase in expense related to contingent consideration fair value adjustments related to our acquisition of LPM of $5.6 million as well as a $3.0 million unrealized loss on our holdings of XAU₮ stablecoin.
Remeasurement Gain (Loss) on Pre-Existing Equity Interests - Wholesale Sales & Ancillary Services
in thousands |
|
|
|
|
|
|
|
|
|
|
|
|
|
|
|
|
|
|
|
|
|
|
|
||||||
Year Ended June 30, |
|
2026 |
|
2025 |
|
Change |
|
||||||||||||||||||||||
|
|
$ |
|
|
|
% of revenue |
|
|
|
$ |
|
|
|
% of revenue |
|
|
|
$ |
|
|
|
% |
|
||||||
Remeasurement gain (loss) on pre-existing equity interests |
|
$ |
4,136 |
|
|
|
|
0.021 |
% |
|
|
$ |
(5,143 |
) |
|
|
|
(0.059 |
%) |
|
|
$ |
9,279 |
|
|
|
|
180.4 |
% |
The Company incurred remeasurement gains and losses on our pre-existing equity interests in Pinehurst in February 2025, AMS in April 2025, and SMI in April 2026 through the acquisition of the remaining equity interests it did not previously own. See further details in Note 1.
51
Results of Operations — Direct-to-Consumer Segment
The Company operates its Direct-to-Consumer segment through its wholly-owned subsidiaries JM Bullion, Inc. (“JMB”), Goldline, Inc. (“Goldline”), Spectrum Group International, LLC ("SGI"), Pinehurst Coin Exchange, Inc. ("Pinehurst"), AMS Holding, LLC ("AMS"), AM LPM Singapore PTE Ltd., Monex Deposit Company ("Monex"), through its investment in Silver Gold Bull, Inc. ("SGB"), and through its subsidiary Precious Metals Purchasing Partners, LLC ("PMPP").
Overview of Results of Operations for the Years Ended June 30, 2026 and 2025
— Direct-to-Consumer Segment
The operating results of our Direct-to-Consumer ("DTC") segment were as follows (in thousands, except performance metrics data):
Year Ended June 30, |
|
2026 |
|
2025 |
|
Change |
|
||||||||||||||||||||||
|
|
$ |
|
|
|
% of revenue |
|
|
|
$ |
|
|
|
% of revenue |
|
|
|
$ |
|
|
|
% |
|
||||||
Revenues |
|
$ |
6,098,216 |
|
(a) |
|
|
100.000 |
% |
|
|
$ |
2,283,257 |
|
(a) |
|
|
100.000 |
% |
|
|
$ |
3,814,959 |
|
|
|
|
167.1 |
% |
Gross profit |
|
|
313,350 |
|
|
|
|
5.138 |
% |
|
|
|
125,041 |
|
|
|
|
5.476 |
% |
|
|
$ |
188,309 |
|
|
|
|
150.6 |
% |
Selling, general, and administrative expenses |
|
|
(170,337 |
) |
|
|
|
(2.793 |
%) |
|
|
|
(78,995 |
) |
|
|
|
(3.460 |
%) |
|
|
$ |
91,342 |
|
|
|
|
115.6 |
% |
Depreciation and amortization expense |
|
|
(27,428 |
) |
|
|
|
(0.450 |
%) |
|
|
|
(19,007 |
) |
|
|
|
(0.832 |
%) |
|
|
$ |
8,421 |
|
|
|
|
44.3 |
% |
Interest income |
|
|
1,231 |
|
|
|
|
0.020 |
% |
|
|
|
146 |
|
|
|
|
0.006 |
% |
|
|
$ |
1,085 |
|
|
|
|
743.2 |
% |
Interest expense |
|
|
(8,774 |
) |
|
|
|
(0.144 |
%) |
|
|
|
(2,255 |
) |
|
|
|
(0.099 |
%) |
|
|
$ |
6,519 |
|
|
|
|
289.1 |
% |
Other income, net |
|
|
7,552 |
|
|
|
|
0.124 |
% |
|
|
|
— |
|
|
|
|
— |
% |
|
|
$ |
7,552 |
|
|
|
|
— |
% |
Losses on foreign exchange |
|
|
(4,473 |
) |
|
|
|
(0.073 |
%) |
|
|
|
(535 |
) |
|
|
|
(0.023 |
%) |
|
|
$ |
3,938 |
|
|
|
|
736.1 |
% |
Net income before provision for income taxes |
|
$ |
111,121 |
|
|
|
|
1.822 |
% |
|
|
$ |
24,395 |
|
|
|
|
1.068 |
% |
|
|
$ |
86,726 |
|
|
|
|
355.5 |
% |
|
|
|
|
|
|
|
|
|
|
|
|
|
|
|
|
|
|
|
|
|
|
|
|
||||||
Performance Metrics: |
|
|
|
|
|
|
|
|
|
|
|
|
|
|
|
|
|
|
|
|
|
|
|
||||||
Gold ounces sold |
|
|
878,000 |
|
|
|
|
|
|
|
|
497,000 |
|
|
|
|
|
|
|
|
381,000 |
|
|
|
|
76.7 |
% |
||
Silver ounces sold |
|
|
28,608,000 |
|
|
|
|
|
|
|
|
17,032,000 |
|
|
|
|
|
|
|
|
11,576,000 |
|
|
|
|
68.0 |
% |
||
Number of new customers |
|
|
526,300 |
|
|
|
|
|
|
|
|
1,129,200 |
|
|
|
|
|
|
|
|
(602,900 |
) |
|
|
|
(53.4 |
%) |
||
Number of active customers |
|
|
783,100 |
|
|
|
|
|
|
|
|
581,300 |
|
|
|
|
|
|
|
|
201,800 |
|
|
|
|
34.7 |
% |
||
Number of total customers |
|
|
4,722,300 |
|
|
|
|
|
|
|
|
4,196,000 |
|
|
|
|
|
|
|
|
526,300 |
|
|
|
|
12.5 |
% |
||
DTC ticket volume from new customers |
|
|
330,825 |
|
|
|
|
|
|
|
|
197,894 |
|
|
|
|
|
|
|
|
132,931 |
|
|
|
|
67.2 |
% |
||
DTC ticket volume from pre-existing customers |
|
|
987,792 |
|
|
|
|
|
|
|
|
606,511 |
|
|
|
|
|
|
|
|
381,281 |
|
|
|
|
62.9 |
% |
||
DTC total ticket volume |
|
|
1,318,617 |
|
|
|
|
|
|
|
|
804,405 |
|
|
|
|
|
|
|
|
514,212 |
|
|
|
|
63.9 |
% |
||
DTC average order value |
|
$ |
4,642 |
|
|
|
|
|
|
|
$ |
2,866 |
|
|
|
|
|
|
|
$ |
1,776 |
|
|
|
|
62.0 |
% |
||
JMB average order value |
|
$ |
2,794 |
|
|
|
|
|
|
|
$ |
2,156 |
|
|
|
|
|
|
|
$ |
638 |
|
|
|
|
29.6 |
% |
||
Revenues — Direct-to-Consumer
in thousands, except performance metrics |
|
|
|
|
|
|
|
|
|
|
|
|
|
|
|
|
|
|
|
|
|
||||||||
Year Ended June 30, |
|
2026 |
|
2025 |
|
Change |
|
||||||||||||||||||||||
|
|
$ |
|
|
|
% of revenue |
|
|
|
$ |
|
|
|
% of revenue |
|
|
|
$ |
|
|
|
% |
|
||||||
Revenues |
|
$ |
6,098,216 |
|
|
|
|
100.000 |
% |
|
|
$ |
2,283,257 |
|
|
|
|
100.000 |
% |
|
|
$ |
3,814,959 |
|
|
|
|
167.1 |
% |
Performance Metrics: |
|
|
|
|
|
|
|
|
|
|
|
|
|
|
|
|
|
|
|
|
|
|
|
||||||
Gold ounces sold |
|
|
878,000 |
|
|
|
|
|
|
|
|
497,000 |
|
|
|
|
|
|
|
|
381,000 |
|
|
|
|
76.7 |
% |
||
Silver ounces sold |
|
|
28,608,000 |
|
|
|
|
|
|
|
|
17,032,000 |
|
|
|
|
|
|
|
|
11,576,000 |
|
|
|
|
68.0 |
% |
||
Number of new customers |
|
|
526,300 |
|
|
|
|
|
|
|
|
1,129,200 |
|
|
|
|
|
|
|
|
(602,900 |
) |
|
|
|
(53.4 |
%) |
||
Number of active customers |
|
|
783,100 |
|
|
|
|
|
|
|
|
581,300 |
|
|
|
|
|
|
|
|
201,800 |
|
|
|
|
34.7 |
% |
||
Number of total customers |
|
|
4,722,300 |
|
|
|
|
|
|
|
|
4,196,000 |
|
|
|
|
|
|
|
|
526,300 |
|
|
|
|
12.5 |
% |
||
DTC ticket volume from new customers |
|
|
330,825 |
|
|
|
|
|
|
|
|
197,894 |
|
|
|
|
|
|
|
|
132,931 |
|
|
|
|
67.2 |
% |
||
DTC ticket volume from pre-existing customers |
|
|
987,792 |
|
|
|
|
|
|
|
|
606,511 |
|
|
|
|
|
|
|
|
381,281 |
|
|
|
|
62.9 |
% |
||
DTC total ticket volume |
|
|
1,318,617 |
|
|
|
|
|
|
|
|
804,405 |
|
|
|
|
|
|
|
|
514,212 |
|
|
|
|
63.9 |
% |
||
DTC average order value |
|
$ |
4,642 |
|
|
|
|
|
|
|
$ |
2,866 |
|
|
|
|
|
|
|
$ |
1,776 |
|
|
|
|
62.0 |
% |
||
JMB average order value |
|
$ |
2,794 |
|
|
|
|
|
|
|
$ |
2,156 |
|
|
|
|
|
|
|
$ |
638 |
|
|
|
|
29.6 |
% |
||
Revenues for the year ended June 30, 2026 increased $3.815 billion, or 167.1%, to $6.098 billion from $2.283 billion in 2025. The increase in revenue was due to an increase in gold and silver ounces sold and higher average selling prices of gold and silver. Revenues also increased due to the acquisitions of SGI and Pinehurst in February 2025, AMS in April 2025, and Monex in January 2026, whose results were not included, or were not fully included in the same year-ago period.
52
Gold ounces sold for the year ended June 30, 2026 increased 381,000 ounces, or 76.7%, to 878,000 ounces from 497,000 ounces in 2025. Silver ounces sold for the year ended June 30, 2026 increased 11,576,000 ounces, or 68.0%, to 28,608,000 ounces from 17,032,000 ounces in 2025.
On average, selling prices for gold increased by 45.4% and selling prices for silver increased by 109.7% during the year ended June 30, 2026 as compared to the prior year.
The number of new customers for the year ended June 30, 2026 decreased 602,900, or 53.4%, to 526,300 from 1,129,200 in 2025. The number of active customers for the year ended June 30, 2026 increased 201,800, or 34.7% to 783,100 from 581,300 in 2025. The number of total customers as of June 30, 2026 increased 526,300, or 12.5% to 4,722,300 from 4,196,000 as of June 30, 2025. These changes in customer-based metrics were primarily due to the acquisitions of Pinehurst and SGI in February 2025, AMS in April 2025, and Monex in January 2026, as well as JMB's activity. Approximately 33% of the new customers for the fiscal year ended June 30, 2026 were attributable to the acquisition of Monex and approximately 79% of the new customers for the fiscal year ended June 30, 2025 were attributable to the acquisitions of SGI, Pinehurst and AMS.
As of June 30, 2026, the number of total CyberMetals customers was 42,600, and CyberMetals customer assets under management were $16.6 million.
For the year ended June 30, 2026, the Direct-to-Consumer ticket volume related to new customers increased by 132,931 tickets, or 67.2%, to 330,825 tickets from 197,894 tickets in 2025. For the year ended June 30, 2026, Direct-to-Consumer ticket volume related to pre-existing customers increased by 381,281 tickets, or 62.9%, to 987,792 tickets from 606,511 tickets in 2025. For the year ended June 30, 2026, the Direct-to-Consumer total ticket volume increased by 514,212 tickets, or 63.9%, to 1,318,617 tickets from 804,405 tickets in 2025. These changes in ticket volumes were primarily due to the acquisitions of Pinehurst in February 2025 and AMS in April 2025, as well as JMB's activity.
For the year ended June 30, 2026, the Direct-to-Consumer average order value increased by $1,776, or 62.0%, to $4,642 from $2,866 in 2025.
Gross Profit — Direct-to-Consumer
in thousands |
|
|
|
|
|
|
|
|
|
|
|
|
|
|
|
|
|
|
|
|
|
||||||||
Year Ended June 30, |
|
2026 |
|
2025 |
|
Change |
|
||||||||||||||||||||||
|
|
$ |
|
|
|
% of revenue |
|
|
|
$ |
|
|
|
% of revenue |
|
|
|
$ |
|
|
|
% |
|
||||||
Gross profit |
|
$ |
313,350 |
|
|
|
|
5.138 |
% |
|
|
$ |
125,041 |
|
|
|
|
5.476 |
% |
|
|
$ |
188,309 |
|
|
|
|
150.6 |
% |
Gross profit for the year ended June 30, 2026 increased by $188.3 million, or 150.6%, to $313.4 million from $125.0 million in 2025. The increase in gross profit was primarily driven by JMB, AMS, SGB, SGI, and Monex. The results from SGI, Pinehurst, AMS, and Monex were not included, or were not fully included in the same year-ago period
For the year ended June 30, 2026, the Direct-to-Consumer segment's profit margin percentage decreased by 33.8 basis points to 5.138% from 5.476% in 2025. The decrease in the gross profit margin percentage was primarily due to lower gross profit margins from SGB and SGI, partially offset by higher gross profit margin percentages of JMB, Goldline, and AMS.
Selling, General and Administrative Expense — Direct-to-Consumer
in thousands |
|
|
|
|
|
|
|
|
|
|
|
|
|
|
|
|
|
|
|
|
|
|
|
||||||
Year Ended June 30, |
|
2026 |
|
2025 |
|
Change |
|
||||||||||||||||||||||
|
|
$ |
|
|
|
% of revenue |
|
|
|
$ |
|
|
|
% of revenue |
|
|
|
$ |
|
|
|
% |
|
||||||
Selling, general, and administrative expenses |
|
$ |
(170,337 |
) |
|
|
|
(2.793 |
%) |
|
|
$ |
(78,995 |
) |
|
|
|
(3.460 |
%) |
|
|
$ |
91,342 |
|
|
|
|
115.6 |
% |
Selling, general, and administrative expenses for the year ended June 30, 2026 increased $91.3 million, or 115.6%, to $170.3 million from $79.0 million in 2025. The change was primarily due to: (i) an increase in compensation expense of $56.3 million, (ii) an increase in advertising costs of $15.9 million, (iii) higher consulting and professional fees of $7.2 million, (iv) an increase in bank service and credit card fees of $4.4 million, (v) an increase in insurance costs of $2.5 million, (vi) an increase in facilities expenses of $2.2 million, and (vii) an increase in information technology costs of $0.2 million. Selling, general and administrative expenses for the year ended June 30, 2026 included $82.6 million of expenses incurred by SGI, Pinehurst, AMS, and Monex, whose results were not included, or were not fully included in the same year-ago period. Excluding the increase from newly acquired subsidiaries, our selling, general and administrative expenses increased $8.7 million from the prior year period.
53
Depreciation and Amortization Expense — Direct-to-Consumer
in thousands |
|
|
|
|
|
|
|
|
|
|
|
|
|
|
|
|
|
|
|
|
|
|
|
||||||
Year Ended June 30, |
|
2026 |
|
2025 |
|
Change |
|
||||||||||||||||||||||
|
|
$ |
|
|
|
% of revenue |
|
|
|
$ |
|
|
|
% of revenue |
|
|
|
$ |
|
|
|
% |
|
||||||
Depreciation and amortization expense |
|
$ |
(27,428 |
) |
|
|
|
(0.450 |
%) |
|
|
$ |
(19,007 |
) |
|
|
|
(0.832 |
%) |
|
|
$ |
8,421 |
|
|
|
|
44.3 |
% |
Depreciation and amortization expense for the year ended June 30, 2026, increased $8.4 million, or 44.3%, to $27.4 million from $19.0 million in 2025 primarily due to an increase in amortization expense of $11.1 million relating to intangible assets acquired through our acquisitions of SGI, AMS, and Monex, and an increase in depreciation expense of $2.8 million due to an increase in capital expenditures, partially offset by a $5.6 million decrease in intangible asset amortization expense related to JMB and SGB.
Interest expense — Direct-to-Consumer
in thousands |
|
|
|
|
|
|
|
|
|
|
|
|
|
|
|
|
|
|
|
|
|
|
|
||||||
Year Ended June 30, |
|
2026 |
|
2025 |
|
Change |
|
||||||||||||||||||||||
|
|
$ |
|
|
|
% of revenue |
|
|
|
$ |
|
|
|
% of revenue |
|
|
|
$ |
|
|
|
% |
|
||||||
Interest expense |
|
$ |
(8,774 |
) |
|
|
|
(0.144 |
%) |
|
|
$ |
(2,255 |
) |
|
|
|
(0.099 |
%) |
|
|
$ |
6,519 |
|
|
|
|
289.1 |
% |
Interest expense for the year ended June 30, 2026 increased $6.5 million to $8.8 million from $2.3 million in 2025. The increase was primarily related to higher interest and fees related to product financing arrangements due to higher interest rates and higher overall borrowings.
Other Income, Net— Direct-to-Consumer
in thousands |
|
|
|
|
|
|
|
|
|
|
|
|
|
|
|
|
|
|
|
|
|
|
|
||||||
Year Ended June 30, |
|
2026 |
|
2025 |
|
Change |
|
||||||||||||||||||||||
|
|
$ |
|
|
|
% of revenue |
|
|
|
$ |
|
|
|
% of revenue |
|
|
|
$ |
|
|
|
% |
|
||||||
Other income, net |
|
$ |
7,552 |
|
|
|
|
0.124 |
% |
|
|
$ |
— |
|
|
|
|
— |
% |
|
|
$ |
7,552 |
|
|
|
|
— |
% |
Other income, net for the year ended June 30, 2026 increased $7.6 million to $7.6 million from $0.0 million in 2025. The increase was primarily due to contingent consideration fair value adjustments related to our acquisitions of Monex and AMS.
Gains and Losses on Foreign Exchange— Direct-to-Consumer
in thousands |
|
|
|
|
|
|
|
|
|
|
|
|
|
|
|
|
|
|
|
|
|
|
|
||||||
Year Ended June 30, |
|
2026 |
|
2025 |
|
Change |
|
||||||||||||||||||||||
|
|
$ |
|
|
|
% of revenue |
|
|
|
$ |
|
|
|
% of revenue |
|
|
|
$ |
|
|
|
% |
|
||||||
Losses on foreign exchange |
|
$ |
(4,473 |
) |
|
|
|
(0.073 |
%) |
|
|
$ |
(535 |
) |
|
|
|
(0.023 |
%) |
|
|
$ |
3,938 |
|
|
|
|
736.1 |
% |
Losses on foreign exchange for the year ended June 30, 2026 increased $3.9 million to $4.5 million from $0.5 million in 2025. The change in our gains and losses on foreign exchange was primarily due to increased sales in Canada.
54
Results of Operations — Secured Lending Segment
The Company operates its Secured Lending segment through its wholly-owned subsidiaries, Collateral Finance Corporation, LLC ("CFC") and CFC Alternative Investments (“CAI”). AM Capital Funding, LLC (“AMCF”), previously a wholly-owned subsidiary of CFC, was formed for the issuance of certain notes, which were repaid in December 2023. AMCF was dissolved in June 2024.
Overview of Results of Operations for the Years Ended June 30, 2026 and 2025
— Secured Lending Segment
The operating results of our Secured Lending segment were as follows (in thousands, except performance metrics data):
in thousands, except performance metrics |
|
|
|
|
|
|
|
|
|
|
|
|
|
|
|
|
|
|
|
|
|
||||||||
Year Ended June 30, |
|
2026 |
|
|
|
2025 |
|
|
|
Change |
|
||||||||||||||||||
|
|
$ |
|
|
|
% of interest |
|
|
|
$ |
|
|
|
% of interest |
|
|
|
$ |
|
|
|
% |
|
||||||
Interest income |
|
$ |
11,701 |
|
|
|
|
100.000 |
% |
|
|
$ |
10,668 |
|
|
|
|
100.000 |
% |
|
|
$ |
1,033 |
|
|
|
|
9.7 |
% |
Interest expense |
|
|
(6,223 |
) |
|
|
|
(53.183 |
%) |
|
|
|
(6,239 |
) |
|
|
|
(58.483 |
%) |
|
|
$ |
(16 |
) |
|
|
|
(0.3 |
%) |
Selling, general, and administrative expenses |
|
|
(1,222 |
) |
|
|
|
(10.444 |
%) |
|
|
|
(1,179 |
) |
|
|
|
(11.052 |
%) |
|
|
$ |
43 |
|
|
|
|
3.6 |
% |
Depreciation and amortization expense |
|
|
(14 |
) |
|
|
|
(0.120 |
%) |
|
|
|
(4 |
) |
|
|
|
(0.037 |
%) |
|
|
$ |
10 |
|
|
|
|
250.0 |
% |
Earnings from equity method investments |
|
|
133 |
|
|
|
|
1.137 |
% |
|
|
|
157 |
|
|
|
|
1.472 |
% |
|
|
$ |
(24 |
) |
|
|
|
(15.3 |
%) |
Other income, net |
|
|
63 |
|
|
|
|
0.538 |
% |
|
|
|
732 |
|
|
|
|
6.862 |
% |
|
|
$ |
(669 |
) |
|
|
|
(91.4 |
%) |
Net income before provision for income taxes |
|
$ |
4,438 |
|
|
|
|
37.928 |
% |
|
|
$ |
4,135 |
|
|
|
|
38.761 |
% |
|
|
$ |
303 |
|
|
|
|
7.3 |
% |
|
|
|
|
|
|
|
|
|
|
|
|
|
|
|
|
|
|
|
|
|
|
|
|
||||||
Performance Metric: |
|
|
|
|
|
|
|
|
|
|
|
|
|
|
|
|
|
|
|
|
|
|
|
||||||
Number of secured loans at period end |
|
|
367 |
|
|
|
|
|
|
|
|
445 |
|
|
|
|
|
|
|
|
(78 |
) |
|
|
|
(17.5 |
%) |
||
Interest Income — Secured Lending
in thousands, except performance metric |
|
|
|
|
|
|
|
|
|
|
|
|
|
|
|
|
|
|
|
|
|
||||||||
Year Ended June 30, |
|
2026 |
|
|
|
2025 |
|
|
|
Change |
|
||||||||||||||||||
|
|
$ |
|
|
|
% of interest |
|
|
|
$ |
|
|
|
% of interest |
|
|
|
$ |
|
|
|
% |
|
||||||
Interest income |
|
$ |
11,701 |
|
|
|
|
100.000 |
% |
|
|
$ |
10,668 |
|
|
|
|
100.000 |
% |
|
|
$ |
1,033 |
|
|
|
|
9.7 |
% |
Performance Metric |
|
|
|
|
|
|
|
|
|
|
|
|
|
|
|
|
|
|
|
|
|
|
|
||||||
Number of secured loans at period-end |
|
|
367 |
|
|
|
|
|
|
|
|
445 |
|
|
|
|
|
|
|
|
(78 |
) |
|
|
|
(17.5 |
%) |
||
Interest income for the year ended June 30, 2026 increased $1.0 million, or 9.7%, to $11.7 million from $10.7 million in 2025. The increase in interest income earned from the segment’s secured loan portfolio was primarily due to higher average monthly loan balances, partially offset by fewer loans outstanding. The number of secured loans outstanding decreased by 78, or 17.5% to 367 from 445 as of June 30, 2025.
Interest Expense — Secured Lending
in thousands |
|
|
|
|
|
|
|
|
|
|
|
|
|
|
|
|
|
|
|
|
|
|
|
||||||
Year Ended June 30, |
|
2026 |
|
|
|
2025 |
|
|
|
Change |
|
||||||||||||||||||
|
|
$ |
|
|
|
% of interest |
|
|
|
$ |
|
|
|
% of interest |
|
|
|
$ |
|
|
|
% |
|
||||||
Interest expense |
|
$ |
(6,223 |
) |
|
|
|
(53.183 |
%) |
|
|
$ |
(6,239 |
) |
|
|
|
(58.483 |
%) |
|
|
$ |
(16 |
) |
|
|
|
(0.3 |
%) |
Interest expense for the year ended June 30, 2026 decreased $0.0 million, or 0.3%, to $6.2 million from $6.2 million in 2025. The change in interest expense was not significant.
Selling, General and Administrative Expenses — Secured Lending
in thousands |
|
|
|
|
|
|
|
|
|
|
|
|
|
|
|
|
|
|
|
|
|
|
|
||||||
Year Ended June 30, |
|
2026 |
|
|
|
2025 |
|
|
|
Change |
|
||||||||||||||||||
|
|
$ |
|
|
|
% of interest |
|
|
|
$ |
|
|
|
% of interest |
|
|
|
$ |
|
|
|
% |
|
||||||
Selling, general, and administrative expenses |
|
$ |
(1,222 |
) |
|
|
|
(10.444 |
%) |
|
|
$ |
(1,179 |
) |
|
|
|
(11.052 |
%) |
|
|
$ |
43 |
|
|
|
|
3.6 |
% |
Selling, general, and administrative expenses for the year ended June 30, 2026 increased $0.0 million, or 3.6%, to $1.2 million from $1.2 million in 2025. The change in selling, general, and administrative expenses was not significant.
55
NON-GAAP MEASURES
Adjusted net income before provision for income taxes
Overview
In addition to our results determined in accordance with U.S. GAAP, we believe the non-GAAP measure of “adjusted net income before provision for income taxes” is useful in evaluating our operating performance. We use this financial measure to present our pre-tax earnings from core business operations. This measure does not have standardized definitions and is not prepared in accordance with U.S. GAAP. The items excluded from this financial measure may have a material impact on our financial results. Certain of those items are non-recurring, while others are non-cash in nature. Accordingly, this non-GAAP financial performance measure should be considered in addition to, and not as a substitute for or superior to, the comparable measures prepared in accordance with U.S. GAAP.
Reconciliation
We calculate this non-GAAP financial performance measure by eliminating from net income or loss before provision for income taxes the impact of items we do not consider indicative of our core operating performance. We eliminate the impact of the following items: (i) remeasurement gains or losses related to pre-existing equity interests, (ii) contingent consideration fair value adjustments, (iii) acquisition costs, (iv) amortization expenses related to intangible assets acquired, and (v) depreciation expense.
See below for the reconciliation of this non-GAAP financial performance measure to its most closely comparable U.S. GAAP measure on our financial statements (in thousands):
Year Ended June 30, |
|
2026 |
|
|
2025 |
|
|
Change |
|
||||||||
|
|
$ |
|
|
$ |
|
|
$ |
|
|
|
% |
|
||||
Net income before provision for income taxes |
|
$ |
109,522 |
|
|
$ |
21,270 |
|
|
$ |
88,252 |
|
|
|
|
414.9 |
% |
Adjustments: |
|
|
|
|
|
|
|
|
|
|
|
|
|
||||
Remeasurement (gain) loss on pre-existing equity interests |
|
|
(4,136 |
) |
|
|
5,143 |
|
|
$ |
(9,279 |
) |
|
|
|
(180.4 |
%) |
Contingent consideration fair value adjustment |
|
|
(890 |
) |
|
|
(1,140 |
) |
|
$ |
(250 |
) |
|
|
|
(21.9 |
%) |
Acquisition costs |
|
|
692 |
|
|
|
4,866 |
|
|
$ |
(4,174 |
) |
|
|
|
(85.8 |
%) |
Amortization of acquired intangibles |
|
|
24,362 |
|
|
|
18,316 |
|
|
$ |
6,046 |
|
|
|
|
33.0 |
% |
Depreciation expense |
|
|
10,390 |
|
|
|
4,604 |
|
|
$ |
5,786 |
|
|
|
|
125.7 |
% |
Adjusted net income before provision for income taxes (non-GAAP) |
|
$ |
139,940 |
|
|
$ |
53,059 |
|
|
$ |
86,881 |
|
|
|
|
163.7 |
% |
Adjustments
Remeasurement gains or losses. When we acquired a controlling interest in SGB in June 2024, the remaining outstanding equity interests of Pinehurst in February 2025, AMS in April 2025, and SMI in April 2026, we had previously owned a noncontrolling equity interest. We are required to estimate the fair value of our pre-existing equity investment as well as any options to acquire additional equity interests and record the change in the value as a remeasurement gain or loss in our consolidated statements of income. We exclude these remeasurement gains and losses when we evaluate our on-going operational performance and to facilitate comparison of period-to-period operational performance.
Contingent consideration fair value adjustments. Upon our acquisitions of LPM, Pinehurst, AMS, and Monex, we recognized contingent consideration liabilities representing the amount we expect to pay in connection with the achievement of certain financial and performance targets. We remeasure these liabilities each reporting period, with the resulting changes recorded as other income and expense in the Company’s consolidated statements of income. We exclude these fair value adjustments when we evaluate our core operating performance and to facilitate comparison of period-to-period operating performance. See Note 3 to the Company's consolidated financial statements for additional information.
Acquisition costs. We incur expenses for professional services rendered in connection with business combinations, which are included as a component of selling, general, and administrative expenses in the Company’s consolidated statements of income. Acquisition expenses are recorded in the periods in which the costs are incurred, and the services are received. We exclude acquisition expenses when we evaluate our core operating performance and to facilitate comparison of period-to-period operating performance.
Amortization of purchased intangibles. Amortization expense of purchased intangibles varies in amount and frequency and is significantly impacted by the timing and size of our acquisitions. Due to amortization expense being non-cash in nature, management finds it useful to exclude these charges from our operating expenses to assist in the review of a measure that more closely corresponds to cash operating income generated from our business. Amortization of purchased intangible assets will recur in future periods. For additional information about the amortization of our purchased intangibles, see Note 9 to the Company’s consolidated financial statements.
56
Depreciation expense. Depreciation expense is calculated using a straight-line method based on the estimated useful lives of the related assets, ranging from three years to twenty-five years. Due to depreciation expense being non-cash in nature, management finds it useful to exclude these charges from our operating expenses to assist in the review of a measure that more closely corresponds to cash operating income generated from our business. See Note 8 to the Company’s consolidated financial statements.
Earnings Before Interest, Taxes, Depreciation, and Amortization
Overview
In addition to the non-GAAP financial performance measure discussed in the section above, we use the non-GAAP liquidity measure “earnings before interest, taxes, depreciation, and amortization” or "EBITDA" to evaluate our business operations before investing activities, interest, and income taxes. Management and external users of our consolidated financial statements, such as industry analysts and investors, may use EBITDA to compare business operations with other publicly traded companies. Investors are cautioned, however, that the definition of EBITDA is not uniform, and other public companies may utilize different measures of EBITDA.
Reconciliation
We calculate EBITDA by eliminating from net income or loss the following items: (i) interest income, (ii) interest expense, (iii) amortization expenses related to intangible assets acquired, (iv) depreciation expense, and (v) income tax expense.
Management believes the most directly comparable GAAP financial measure is “net cash provided by or used in operating activities” presented in the consolidated statement of cash flows. Below is the reconciliation of net income and net cash provided by or used in operating activities to EBITDA (in thousands):
Year Ended June 30, |
|
2026 |
|
|
2025 |
|
|
Change |
|
||||||||
Reconciliation of Net Income to EBITDA: |
|
$ |
|
|
$ |
|
|
$ |
|
|
|
% |
|
||||
Net income |
|
$ |
88,615 |
|
|
$ |
15,844 |
|
|
$ |
72,771 |
|
|
|
|
459.3 |
% |
Adjustments: |
|
|
|
|
|
|
|
|
|
|
|
|
|
||||
Interest income |
|
|
(25,634 |
) |
|
|
(25,948 |
) |
|
$ |
(314 |
) |
|
|
|
(1.2 |
%) |
Interest expense |
|
|
61,110 |
|
|
|
46,203 |
|
|
$ |
14,907 |
|
|
|
|
32.3 |
% |
Amortization of acquired intangibles |
|
|
24,362 |
|
|
|
18,316 |
|
|
$ |
6,046 |
|
|
|
|
33.0 |
% |
Depreciation expense |
|
|
10,390 |
|
|
|
4,604 |
|
|
$ |
5,786 |
|
|
|
|
125.7 |
% |
Income tax expense |
|
|
20,907 |
|
|
|
5,426 |
|
|
$ |
15,481 |
|
|
|
|
285.3 |
% |
|
|
|
91,135 |
|
|
|
48,601 |
|
|
$ |
42,534 |
|
|
|
|
87.5 |
% |
|
|
|
|
|
|
|
|
|
|
|
|
|
|
||||
Earnings before interest, taxes, depreciation, and amortization (non-GAAP) |
|
$ |
179,750 |
|
|
$ |
64,445 |
|
|
$ |
115,305 |
|
|
|
|
178.9 |
% |
|
|
|
|
|
|
|
|
|
|
|
|
|
|
||||
Reconciliation of Operating Cash Flows to EBITDA: |
|
|
|
|
|
|
|
|
|
|
|
|
|
||||
Net cash provided by operating activities |
|
$ |
1,222,784 |
|
|
$ |
152,347 |
|
|
$ |
1,070,437 |
|
|
|
|
702.6 |
% |
Changes in operating working capital |
|
|
(1,101,089 |
) |
|
|
(103,889 |
) |
|
$ |
997,200 |
|
|
|
|
959.9 |
% |
Interest expense |
|
|
61,110 |
|
|
|
46,203 |
|
|
$ |
14,907 |
|
|
|
|
32.3 |
% |
Interest income |
|
|
(25,634 |
) |
|
|
(25,948 |
) |
|
$ |
(314 |
) |
|
|
|
(1.2 |
%) |
Income tax expense |
|
|
20,907 |
|
|
|
5,426 |
|
|
$ |
15,481 |
|
|
|
|
285.3 |
% |
Earnings (losses) from equity method investments |
|
|
4,391 |
|
|
|
(2,825 |
) |
|
$ |
7,216 |
|
|
|
|
255.4 |
% |
Remeasurement gain (loss) on pre-existing equity interests |
|
|
4,136 |
|
|
|
(5,143 |
) |
|
$ |
9,279 |
|
|
|
|
180.4 |
% |
Share-based compensation |
|
|
(2,407 |
) |
|
|
(1,594 |
) |
|
$ |
813 |
|
|
|
|
51.0 |
% |
Amortization of loan cost |
|
|
(4,267 |
) |
|
|
(4,092 |
) |
|
$ |
175 |
|
|
|
|
4.3 |
% |
Other |
|
|
(181 |
) |
|
|
3,960 |
|
|
$ |
(4,141 |
) |
|
|
|
(104.6 |
%) |
Earnings before interest, taxes, depreciation, and amortization (non-GAAP) |
|
$ |
179,750 |
|
|
$ |
64,445 |
|
|
$ |
115,305 |
|
|
|
|
178.9 |
% |
|
|
|
|
|
|
|
|
|
|
|
|
|
|
||||
Cash Flow Data: |
|
|
|
|
|
|
|
|
|
|
|
|
|
||||
Net cash provided by operating activities |
|
$ |
1,222,784 |
|
|
$ |
152,347 |
|
|
$ |
1,070,437 |
|
|
|
|
702.6 |
% |
Net cash used in investing activities |
|
$ |
(90,078 |
) |
|
$ |
(104,665 |
) |
|
$ |
(14,587 |
) |
|
|
|
(13.9 |
%) |
Net cash used in financing activities |
|
$ |
(632,471 |
) |
|
$ |
(18,577 |
) |
|
$ |
613,894 |
|
|
|
|
3,304.6 |
% |
57
LIQUIDITY AND FINANCIAL CONDITION
Primary Sources and Uses of Cash
Overview
Liquidity refers to the availability of cash for the Company to meet all of our cash needs. Our sources of liquidity principally include cash from operations, precious metals leases, Trading Credit Facility (see “Lines of Credit” below), and product financing arrangements.
A substantial portion of our assets are liquid. As of June 30, 2026, approximately 86% of our assets consisted of cash, receivables, derivative assets, secured loans receivables, precious metals held under financing arrangements, and inventories, measured at fair value. Cash generated from the sales or financing of our precious metals products is our primary source of operating liquidity. Among other things, these include our product financing arrangements, liabilities on borrowed metals, and precious metals leases. Typically, the Company acquires its inventory by: (i) purchasing inventory from its suppliers by utilizing our own capital and lines of credit; (ii) borrowing precious metals from its suppliers under short-term arrangements which may bear interest at a designated rate, and (iii) repurchasing inventory at an agreed-upon price based on the spot price on the specified repurchase date.
In addition to selling inventory, the Company generates cash from earning interest income. The Company enters into secured loans and secured financing structures with its customers under which it charges interest. The loans are secured by precious metals and numismatic material, and graded sports cards owned by the borrowers and held by the Company as security for the term of the loan. The Company also offers a number of secured financing options to its customers to finance their precious metals purchases including consignments and other structured inventory finance products. Furthermore, our customers may enter into agreements whereby the customer agrees to repurchase our precious metals at the prevailing spot price for delivery of the product at a specific point in time in the future; interest income is earned from the contract date until the material is delivered and paid for in full.
We may also raise funds through the public or private offering of equity or debt securities, although there is no assurance that we will be able to do so at the times and in the amounts required.
We continually review our overall credit and capital needs to ensure that our capital base, both stockholders’ equity and available credit facilities, can appropriately support our anticipated financing needs. The Company also continually monitors its current and forecasted cash requirements and draws upon and pays down its debt obligations so as to minimize interest expense. See Note 15 to the Company's consolidated financial statements.
Lines of Credit
in thousands |
|
|
|
|
|
|
|
|
|
|||
|
|
June 30, 2026 |
|
|
June 30, 2025 |
|
|
Change |
|
|||
Lines of credit |
|
$ |
— |
|
|
$ |
345,000 |
|
|
$ |
(345,000 |
) |
Effective December 21, 2021, the Company entered into a committed borrowing facility (the "Trading Credit Facility") with CIBC Bank USA, as agent and joint lead arranger, and a syndicate of banks. As of June 30, 2026, the Trading Credit Facility provided the Company with access up to $427.5 million and has a maturity date of September 30, 2027. (See Note 15.)
When needed, the Company uses funds drawn under the Trading Credit Facility to purchase metals from its suppliers and for other operating cash flow purposes. Our CFC subsidiary also uses funds drawn under the Trading Credit Facility to finance certain of its lending activities.
Notes Payable
in thousands |
|
|
|
|
|
|
|
|
|
|||
|
|
June 30, 2026 |
|
|
June 30, 2025 |
|
|
Change |
|
|||
Notes payable — short-term |
|
$ |
4,000 |
|
|
$ |
3,994 |
|
|
$ |
6 |
|
Notes payable — long-term |
|
|
206 |
|
|
|
3,349 |
|
|
|
(3,143 |
) |
|
|
$ |
4,206 |
|
|
$ |
7,343 |
|
|
$ |
(3,137 |
) |
In April 2021, CCP entered into a loan agreement ("CCP Note") with CFC, which provides CFC with up to $4.0 million to fund commercial loans secured by graded sports cards to its borrowers. All loans to be funded using the proceeds from the CCP Note are subject to CCP’s prior written approval. The CCP Note has been amended to expire April 1, 2028. As of June 30, 2026 and June 30, 2025 the outstanding principal balance of the CCP Note was $4.0 million and $4.0 million. See Note 14 to the Company's consolidated financial statements.
In June 2024, SGB declared a $15.9 million dividend to existing shareholders based on certain levels of working capital. As of June 30, 2026, the dividend was paid in full, including a dividend paid to the Company from SGB in September 2024 of $7.5 million.
58
In February 2025 in connection with the acquisition of Pinehurst, the Company assumed a promissory note with the former majority owner of Pinehurst for $3.1 million. This promissory note had a maturity date of August 1, 2026 and bore interest at a rate of 5% per annum. The promissory note was repaid in full during the three months ended June 30, 2026.
Liabilities on Borrowed Metals and Precious Metals Leases
in thousands |
|
|
|
|
|
|
|
|
|
|||
|
|
June 30, 2026 |
|
|
June 30, 2025 |
|
|
Change |
|
|||
Liabilities on borrowed metals |
|
$ |
776,061 |
|
|
$ |
46,051 |
|
|
$ |
730,010 |
|
|
|
|
|
|
|
|
|
|
|
|||
Precious metals leases |
|
$ |
1,687,603 |
|
|
$ |
246,540 |
|
|
$ |
1,441,063 |
|
We borrow precious metals from our suppliers and customers under short-term arrangements using other precious metal from our inventory or precious metals held under financing arrangements as collateral. Amounts under these arrangements require repayment either in the form of precious metals or cash. Liabilities also arise from metal positions held by customers in our inventory. Typically, these positions are due on demand, in a specified physical form, based on the total ounces of metal held in the position.
We lease precious metals from our suppliers and customers under short-term arrangements, in which the lease terms and interest rates are established at lease inception. Precious metals leases are included in deferred revenue and other advances on the consolidated balance sheet. Amounts under these arrangements may be settled in precious metals or cash.
Product Financing Arrangements
in thousands |
|
|
|
|
|
|
|
|
|
|||
|
|
June 30, 2026 |
|
|
June 30, 2025 |
|
|
Change |
|
|||
Product financing arrangements |
|
$ |
89,249 |
|
|
$ |
484,733 |
|
|
$ |
(395,484 |
) |
The Company has agreements with financial institutions and other third parties that allow the Company to transfer its gold and silver inventory to the third-party at an agreed-upon price based on the spot price, which provides alternative sources of liquidity. During the term of the agreement both parties intend for inventory to be returned at an agreed-upon price based on the spot price on the repurchase date. The third parties charge monthly interest as a percentage of the market value of the outstanding obligation; such monthly charges are classified as interest expense. These transactions do not qualify as sales and therefore are accounted for as financing arrangements and reflected in the Company’s consolidated balance sheets as product financing arrangements. The obligation is stated at the amount required to repurchase the outstanding inventory. Both the product financing arrangements and the underlying inventory (which is entirely restricted) are carried at fair value, with changes in fair value included as a component of cost of sales.
Secured Loans Receivable
in thousands |
|
|
|
|
|
|
|
|
|
|||
|
|
June 30, 2026 |
|
|
June 30, 2025 |
|
|
Change |
|
|||
Secured loans receivable |
|
$ |
115,128 |
|
|
$ |
94,037 |
|
|
$ |
21,091 |
|
CFC is a California licensed finance lender that makes and acquires commercial loans secured by bullion and numismatic coins, and graded sports cards that affords our customers a convenient means of financing their inventory or collections. See Note 5 to the Company’s consolidated financial statements. Most of the Company's secured loans are short-term in nature. The renewal of these secured loans is at the discretion of the Company and, as such, provides us with some flexibility in regard to our capital deployment strategies.
Dividends
The Company’s board of directors has adopted a regular quarterly cash dividend policy of $0.20 per common share ($0.80 per share on an annual basis). The declaration of regular cash dividends in the future is subject to the determination each quarter by the board of directors. Below is a summary of dividends paid to stockholders in the year ended June 30, 2026.
59
See Note 17 and Note 20 to the Company's consolidated financial statements for more information regarding our dividends.
Cash Flows
The majority of the Company’s trading activities involve two-day value trades under which payment is received in advance of delivery or product is received in advance of payment. The combination of sales volume, inventory turnover, and precious metals price volatility can cause material changes in the sources of cash used in or provided by operating activities on a daily basis. The Company manages these variances through its liquidity forecasts and counterparty limits by maintaining a liquidity reserve to meet the Company’s cash needs. The Company uses various short-term financial instruments to manage the cycle of our trading activities from customer purchase order to cash collections and product delivery, which can cause material changes in the amount of cash used in or provided by financing activities on a daily basis.
The following summarizes components of our consolidated statements of cash flows (in thousands):
Year Ended |
|
June 30, 2026 |
|
|
June 30, 2025 |
|
|
Change |
|
|||
Net cash provided by operating activities |
|
$ |
1,222,784 |
|
|
$ |
152,347 |
|
|
$ |
1,070,437 |
|
Net cash used in investing activities |
|
$ |
(90,078 |
) |
|
$ |
(104,665 |
) |
|
$ |
(14,587 |
) |
Net cash used in financing activities |
|
$ |
(632,471 |
) |
|
$ |
(18,577 |
) |
|
$ |
613,894 |
|
For the periods presented, our principal capital requirements have been to fund (i) working capital and (ii) financing activity. Our working capital requirements fluctuated with market conditions, the availability of precious metals, and the volatility of precious metals commodity pricing.
Net Cash Flows From Operating Activities
Operating activities provided $1.223 billion and provided $152.3 million in cash for the year ended June 30, 2026 and 2025, respectively, representing a $1.070 billion change compared to the year ended June 30, 2025. The period over period change was primarily due to net changes in working capital, which includes deferred revenue and other advances, inventories, derivative assets and liabilities, liabilities on borrowed metals, and accounts payable and other payables, as well as an increase in net income adjusted for non-cash items.
Net Cash Flows From Investing Activities
Investing activities used $90.1 million and used $104.7 million in cash for the year ended June 30, 2026 and 2025, respectively, representing a $14.6 million change compared to the year ended June 30, 2025. This period over period change was primarily due to a decrease in cash used in acquisitions of businesses of $79.5 million which is due to the acquisitions of SGI and Pinehurst in February 2025 compared to the acquisitions of Monex in January 2026 and SMI in April 2026. This was partially offset by: (i) higher outflows of $40.1 million associated with the secured loans receivables in the current period, (ii) a $6.4 million increase in purchases of long-term investments, (iii) a $2.0 million increase in capital expenditures for property, plant and equipment, (iv) a decrease in net proceeds from sale of marketable securities of $1.7 million, and (v) a $1.7 million increase in purchases of intangible assets.
Net Cash Flows From Financing Activities
Financing activities used $632.5 million and used $18.6 million in cash for the year ended June 30, 2026 and 2025, respectively, representing a $613.9 million change compared to the year ended June 30, 2025. This period over period change was primarily due to: (i) a decrease in cash provided from our net borrowings and repayments of $445.0 million under our Trading Credit Facility, (ii) a decrease in cash provided of $310.5 million related to our product financing arrangements, and (iii) an increase in dividends paid of $3.7 million, partially offset by (iv) a $140.0 million increase in proceeds from the issuance of common stock due to the common stock issuance to Tether, (v) a reduction of $8.4 million in repayments of notes payable to a related party, (vi) reduced outflows of $5.1 million from the decrease in repurchases of our common stock, and (vii) a $1.5 million decrease of debt funding issuance costs.
Capital Resources
We believe that our current cash availability under the Trading Credit Facility, product financing arrangements, financing derived from borrowed and leased metal arrangements and the cash we anticipate generating from operating activities will provide us with sufficient liquidity to satisfy our working capital needs, capital expenditures, investment requirements, and commitments through at least the next twelve months.
60
CONTRACTUAL OBLIGATIONS, CONTINGENT LIABILITIES AND COMMITMENTS
Counterparty Risk
We face counterparty risks in our Wholesale Sales & Ancillary Services segment. We manage these risks by setting credit and position risk limits with our trading counterparties, including gross position limits for counterparties engaged in sales and purchase transactions and inventory consignment transactions with us, as well as collateral limits for different types of sale and purchase transactions that counterparties may engage in from time to time.
Commodities Risk and Derivatives
We use a variety of strategies to manage our risk including fluctuations in commodity prices for precious metals. Our inventory consists of, and our trading activities involve, precious metals and precious metal products, for which prices are linked to the corresponding precious metal commodity prices. The Company's precious metals inventory is subject to fluctuations in market value, resulting from changes in the underlying commodity prices. Inventory purchased or borrowed by us is subject to price changes. Inventory borrowed is a natural hedge since changes in the value of the metal held are offset by the obligation to return the metal to the supplier or deliver metals to the customer.
Open sale and purchase commitments in our trading activities are subject to changes in value between the date the purchase or sale price is fixed (the trade date) and the date the metal is received or delivered (the settlement date). We seek to minimize the effect of price changes of the underlying commodity through the use of forward and futures contracts. Our open sale and purchase commitments generally settle within two business days, and for those commitments that do not have stated settlement dates, we have the right to settle the positions upon demand.
Our policy is to substantially hedge our inventory position, net of open sale and purchase commitments that are subject to price risk. We regularly enter into precious metals commodity forward and futures contracts with financial institutions to hedge against this risk. We use futures contracts, which typically settle within 30 days, for our shorter-term hedge positions, and forward contracts, which may remain open for up to six months, for our longer-term hedge positions. We have access to all of the precious metals markets, allowing us to place hedges. We also maintain relationships with major market makers in every major precious metals dealing center.
The Company enters into these derivative transactions solely for the purpose of hedging our inventory holding risk, and not for speculative market purposes. Due to the nature of our hedging strategy, we are not using hedge accounting as defined under Accounting Standards Codification ("ASC") Topic 815 Derivatives and Hedging ("ASC 815"). Unrealized gains or losses resulting from our forward and futures contracts are reported as cost of sales with the related amounts due from or to counterparties reflected as derivative assets or liabilities. The Company adjusts the derivatives to fair value on a daily basis until the transactions are settled. When these contracts are net settled, the unrealized gains and losses are reversed and the realized gains and losses for forward contracts are recorded in revenue and cost of sales, respectively, and the net realized gains and losses for futures are recorded in cost of sales.
The Company’s net gains and losses on derivative instruments totaled gains of $11.8 million and losses of $101.0 million, for the years ended June 30, 2026 and 2025, respectively. These were substantially offset by the changes in fair market value of the underlying precious metals inventory, which is also recorded in cost of sales in the consolidated statements of income.
61
The purpose of the Company's hedging policy is to substantially match the change in the value of the derivative financial instrument to the change in the value of the underlying hedged item. The following table summarizes the results of our hedging activities, showing the precious metal commodity inventory position, net of open sale and purchase commitments, which is subject to price risk, compared to change in the value of the derivative instruments (in thousands):
|
|
June 30, 2026 |
|
|
June 30, 2025 |
|
||
Inventories |
|
$ |
2,360,336 |
|
|
$ |
1,279,545 |
|
|
|
|
|
|
|
|
||
Less unhedgeable inventories: |
|
|
|
|
|
|
||
Collectible coin inventory, held at lower of cost or net realizable value |
|
|
(91,339 |
) |
|
|
(68,193 |
) |
Premium on metals position |
|
|
(11,245 |
) |
|
|
(35,295 |
) |
Precious metal value not hedged |
|
|
(102,584 |
) |
|
|
(103,488 |
) |
|
|
|
|
|
|
|
||
Commitments at market: |
|
|
|
|
|
|
||
Open inventory purchase commitments |
|
|
1,463,181 |
|
|
|
1,149,622 |
|
Open inventory sales commitments |
|
|
(2,659,026 |
) |
|
|
(521,442 |
) |
Margin sales commitments |
|
|
(30,480 |
) |
|
|
(27,446 |
) |
In-transit inventory no longer subject to market risk |
|
|
(23,934 |
) |
|
|
(18,801 |
) |
Unhedgeable premiums on open commitment positions |
|
|
1,885 |
|
|
|
10,345 |
|
Borrowed precious metals |
|
|
(776,061 |
) |
|
|
(46,051 |
) |
Product financing arrangements |
|
|
(89,249 |
) |
|
|
(484,733 |
) |
Advances on industrial metals |
|
|
1,248 |
|
|
|
584 |
|
|
|
|
(2,112,436 |
) |
|
|
62,078 |
|
|
|
|
|
|
|
|
||
Precious metals inventory subject to price risk |
|
|
145,316 |
|
|
|
1,238,135 |
|
|
|
|
|
|
|
|
||
Precious metals subject to derivative financial instruments: |
|
|
|
|
|
|
||
Precious metals forward contracts at market values |
|
|
(407,606 |
) |
|
|
927,990 |
|
Precious metals futures contracts at market values |
|
|
548,051 |
|
|
|
310,645 |
|
Total market value of derivative financial instruments |
|
|
140,445 |
|
|
|
1,238,635 |
|
|
|
|
|
|
|
|
||
Net precious metals inventory subject to commodity price risk |
|
$ |
4,871 |
|
|
$ |
(500 |
) |
We are exposed to the risk of default of the counterparties to our derivative contracts. Significant judgment is applied by us when evaluating the fair value implications. We regularly review the creditworthiness of our major counterparties and monitor our exposure to concentrations. As of June 30, 2026, we believe our risk of counterparty default is limited based on our evaluation of the creditworthiness of our major counterparties, the strong financial condition of our counterparties, and the short-term duration of these arrangements.
We had the following outstanding sale and purchase commitments and open forward and futures contracts, which are normal and recurring, in nature (in thousands):
|
|
June 30, 2026 |
|
|
June 30, 2025 |
|
||
Purchase commitments |
|
$ |
1,463,181 |
|
|
$ |
1,149,622 |
|
Sales commitments |
|
$ |
(2,659,026 |
) |
|
$ |
(521,442 |
) |
Margin sales commitments |
|
$ |
(30,480 |
) |
|
$ |
(27,446 |
) |
Open forward contracts |
|
$ |
(407,606 |
) |
|
$ |
927,990 |
|
Open futures contracts |
|
$ |
548,051 |
|
|
$ |
310,645 |
|
Foreign exchange forward contracts |
|
$ |
212 |
|
|
$ |
6,618 |
|
The notional amounts of the commodity forward and futures contracts and the open sales and purchase orders, as shown in the table above, are not reflected at the notional amounts in the consolidated balance sheets. The Company records commodity forward and futures contracts at the fair value, which is the difference between the market price of the underlying metal or contract measured on the reporting date and the trade amount measured on the date the contract was transacted. The fair value of the open derivative contracts is shown as a component of derivative assets or derivative liabilities in the accompanying consolidated balance sheets.
The Company enters into the derivative forward and futures transactions solely for the purpose of hedging its inventory holding risk, and not for speculative market purposes. The Company’s gains and losses on derivative instruments are substantially offset by the changes in fair market value of the underlying precious metals inventory position, including our open sale and purchase commitments. The Company records the derivatives at the trade date, and any corresponding unrealized gains or losses are shown as a component of cost of sales in the consolidated statements of income. We adjust the carrying value of the derivatives to fair value on a daily basis until the transactions are physically settled. See Note 12 to the Company’s consolidated financial statements.
Commitments and Contingencies
Refer to Note 16 to the Company’s consolidated financial statements for information related to the Company's commitments and contingencies.
62
CRITICAL ACCOUNTING POLICIES AND ESTIMATES
The Company’s consolidated financial statements are prepared in accordance with accounting principles generally accepted in the United States (“U.S. GAAP”). In connection with the preparation of our financial statements, we are required to make estimates and assumptions about future events and apply judgments that affect the reported amounts of assets, liabilities, revenue, expenses and related disclosures. We base our assumptions, estimates and judgments on historical experience, current trends and other factors that we believe to be relevant at the time the Company’s consolidated financial statements are prepared. On a regular basis, we review our accounting policies, assumptions, estimates and judgments to ensure that the Company’s consolidated financial statements are presented fairly and in accordance with U.S. GAAP. However, because future events and their effects cannot be determined with certainty, actual results could materially differ from our estimates.
Our significant accounting policies are discussed in Note 2 to the Company’s consolidated financial statements. We believe that the following accounting policies are the most critical to aid in fully understanding and evaluating our reported financial results, and they require our most difficult, subjective or complex judgments, resulting from the need to make estimates about the effect of matters that are inherently uncertain. We have reviewed these critical accounting estimates and related disclosures with the Audit Committee of our board of directors.
Revenue Recognition
The Company accounts for a majority of its metals and sales contracts using settlement date accounting. Pursuant to such accounting, the Company recognizes the sale or purchase of the metals at settlement date. During the period between the trade and settlement dates, the Company enters into forward contracts that meet the definition of a derivative in accordance with the ASC 815. The Company records the derivative at the trade date with any corresponding unrealized gain (loss), shown as component of cost of sales in the consolidated statements of income. The Company adjusts the derivatives to fair value on a daily basis until the transactions are settled. When these contracts are settled, the unrealized gains and losses are reversed, and revenue is recognized for contracts that are physically settled. For contracts that are net settled, the realized gains and losses are recorded in cost of sales, with the exception of forward contracts, where their associated realized gains and losses are recorded in revenue and cost of sales, respectively.
Also, the Company recognizes its sale of collectible coins, storage, logistics, licensing, specialized auction, minting and refining, and other services revenues in accordance with ASC 606, Revenue from Contracts with Customers, which follows five basic steps to determine whether revenue can be recognized: (i) identify the contract with a customer; (ii) identify the performance obligations in the contract; (iii) determine the transaction price; (iv) allocate the transaction price to the performance obligations in the contract, and (v) recognize revenue when (or as) the entity satisfies a performance obligation.
Inventories
The Company's inventory, which primarily consists of bullion and bullion coins, is acquired and initially recorded at cost and then marked to fair market value. The fair market value of the bullion and bullion coins comprises two components: (i) published market values attributable to the cost of the raw precious metal, and (ii) the market value of the premium, which is attributable to the incremental value of the product in its finished goods form. The market value attributable solely to such premium is readily determinable by reference to multiple sources. The precious metal component of the inventory may be hedged through the use of precious metal commodity positions, while the premium component of our inventory is not a commodity that may be hedged.
The Company’s inventory, except for certain lower of cost or net realizable value basis products (as described below), is subsequently recorded at its fair market value. The daily changes in the fair market value of our inventory are offset by daily changes in the fair market value of hedging derivatives that are taken with respect to our inventory positions; both the change in the fair market value of the inventory and the change in the fair market value of these derivative instruments are recorded in cost of sales in the consolidated statements of income.
While the premium component included in inventory is marked-to-market, our collectible coin inventory, including its premium component, is held at the lower of cost or net realizable value, because the value of collectible coins is influenced more by supply and demand determinants than by the underlying spot price of the precious metal content of the collectible coins. Unlike our bullion coins, the value of collectible coins is not subject to the same level of volatility as bullion coins because our collectible coins typically carry a substantially higher premium over the spot metal price than bullion coins. Additionally, neither the collectible coin inventory nor the premium component of our inventory is hedged.
Inventory includes amounts borrowed from suppliers and customers arising from various arrangements including unallocated metal positions held by customers in the Company’s inventory, amounts due to suppliers for the use of consigned inventory, metals held by suppliers as collateral on advanced pool metals, as well as shortages in unallocated metal positions held by the Company in the supplier’s inventory. Unallocated or pool metal represents an unsegregated inventory position that is due on demand, in a specified physical form, based on the total ounces of metal held in the position. Amounts under these arrangements require delivery either in the form of precious metals or cash. The Company mitigates market risk of its physical inventory and open commitments through commodity hedge transactions. See Note 12 to the Company’s consolidated financial statements.
63
The Company enters into product financing agreements with third-party finance companies for the transfer and subsequent option or obligation to reacquire its precious metals inventory at a later date. This inventory is restricted and is held at a custodial storage facility in exchange for a financing fee, charged by the third-party finance company. During the term of the financing agreement, the third-party company holds the inventory as collateral, and both parties intend for the inventory to be returned to the Company at an agreed-upon price based on the spot price on the repurchase date. The third-party charges a monthly fee as a percentage of the market value of the outstanding obligation; such monthly charge is classified as interest expense. These transactions do not qualify as sales and have been accounted for as financing arrangements in accordance with ASC 470-40 Product Financing Arrangements, and are reflected in the Company’s consolidated balance sheets as product financing arrangements. The obligation is stated at the amount required to repurchase the outstanding inventory. Both the product financing and the underlying inventory (which is restricted) are carried at fair value, with changes in fair value included in cost of sales in the Company’s consolidated statements of income.
The Company periodically loans metals to customers on a short-term consignment basis. Such inventory is removed at the time the customer elects to price and purchase the metals, and the Company records a corresponding sale and receivable.
The Company enters into financing arrangements with certain customers under which the Company purchases precious metals products that are subject to repurchase by the customer at the fair value of the product on the repurchase date. The Company or the counterparty may typically terminate any such arrangement with 14 days' notice. Upon termination the customer’s rights to repurchase any remaining inventory is forfeited.
Business Combinations
The accounting for a business combination requires tangible and intangible assets acquired and liabilities assumed to be recorded at estimated fair value. We value intangible assets at their estimated fair values at the acquisition date based upon assumptions related to the future cash flows and discount rates utilizing the then currently available information, and in some cases, valuation results from independent valuation specialists. The use of a discounted cash flow analysis requires significant judgment to estimate the future cash flows derived from the asset and the expected period of time over which those cash flows will occur and to determine an appropriate discount rate.
We make certain judgments and estimates when determining the fair value of assets acquired and liabilities assumed in a business combination. Those judgments and estimates also include determining the lives assigned to acquired intangibles, the resulting amortization period, what indicators will trigger an impairment, whether those indicators are other than temporary, what economic or competitive factors affect valuation, valuation methodology, and key assumptions including discount rates and cash flow estimates. In circumstances where an acquisition involves a contingent consideration arrangement, we recognize a liability equal to the fair value of the expected contingent payments as of the acquisition date. We remeasure this liability each reporting period, with the resulting changes recorded in earnings. The assumptions used in estimating fair value of contingent consideration liabilities require significant judgment; the use of different assumptions and judgments could result in a materially different estimate of fair value which may have a material impact on our results from operations and financial position.
Goodwill and Other Purchased Intangible Assets
We evaluate goodwill and other indefinite-lived intangibles for impairment annually in the fourth quarter of the fiscal year (or more frequently if indicators of potential impairment exist) in accordance with the Intangibles - Goodwill and Other Topic 350 of the ASC (“ASC 350”). Other finite-lived intangible assets are evaluated for impairment when events or changes in business circumstances indicate that the carrying amount of the assets may not be recoverable. We may first qualitatively assess whether relevant events and circumstances make it more likely than not that the fair value of the reporting unit's goodwill is less than its carrying value. If, based on this qualitative assessment, we determine that goodwill is more likely than not to be impaired, a quantitative impairment test is performed. This step requires us to determine the fair value of the business and compare the calculated fair value of a reporting unit with its carrying amount, including goodwill. If through this quantitative analysis the Company determines the fair value of a reporting unit exceeds its carrying amount, the goodwill of the reporting unit is considered not to be impaired. If the Company concludes that the fair value of the reporting unit is less than its carrying value, a goodwill impairment will be recognized for the amount by which the carrying amount exceeds the reporting unit’s fair value.
64
The Company also performs impairment reviews on its indefinite-lived intangible assets (i.e., trade names, trademarks and domain names). In assessing its indefinite-lived intangible assets for impairment, the Company has the option to first perform a qualitative assessment to determine whether events or circumstances exist that lead to a determination that it is more likely than not that the fair value of the indefinite-lived intangible asset is less than its carrying amount. If the Company determines that it is not more likely than not that the fair value of an indefinite-lived intangible asset is less than its carrying amount, the Company is not required to perform any additional tests in assessing the asset for impairment. However, if the Company concludes otherwise or elects not to perform the qualitative assessment, then it is required to perform a quantitative analysis to determine if the fair value of an indefinite-lived intangible asset is less than its carrying value. If through a quantitative analysis the Company determines the fair value of an indefinite-lived intangible asset exceeds its carrying amount, the indefinite-lived intangible asset is considered not to be impaired. If the Company concludes that the fair value of an indefinite-lived intangible asset is less than its carrying value, an impairment will be recognized for the amount by which the carrying amount exceeds the indefinite-lived intangible asset’s fair value.
In the fiscal third quarter of 2025, the Company experienced a sustained decline in its stock price, which resulted in a market capitalization that was below the Company’s book value. The Company considered this a triggering event for interim impairment testing of the related goodwill, definite-live intangible assets and property for its material reporting units in fiscal year 2025.
The Company performed a quantitative assessment for these reporting units and concluded that the fair value of the reporting units exceeded their carrying value. Therefore, no impairment was recorded. The Company determined the fair value of the reporting unit using a discounted cash flow ("DCF") model. The Company also used a market-based approach, which considered economic and comparable company metrics, to corroborate the fair value results. The determination of fair value using the DCF model requires significant judgment including the projection of cash flows and the selection of appropriate discount rates. The cash flows for each reporting unit are based on the Company’s internal forecast. The discount rate used in the DCF model is an estimate of the weighted average cost of capital for the reporting units, which takes into account the relative risk of the cash flows and the time value of money.
If the Company’s future results or the anticipated timing of the recovery do not meet current expectations, it could result in a future impairment charge. There can be no assurance that the Company’s estimates and assumptions regarding the projected cash flows and discount rates made for purposes of the impairment tests will prove to be accurate predictions of the future.
Income Taxes
As part of the process of preparing the Company's consolidated financial statements, the Company is required to estimate its provision for income taxes in each of the tax jurisdictions in which it conducts business, in accordance with Income Taxes Topic 740 of the ASC ("ASC 740"). The Company computes its annual tax rate based on the statutory tax rates and tax planning opportunities available to it in the various jurisdictions in which it earns income. Significant judgment is required in determining the Company's annual tax rate and in evaluating uncertainty in its tax positions. The Company has adopted the provisions of ASC 740-10, which clarifies the accounting for uncertain tax positions. ASC 740-10 requires that the Company recognize the impact of a tax position in the financial statements if the position is not more likely than not to be sustained upon examination based on the technical merits of the position. The Company recognizes interest and penalties related to certain uncertain tax positions as a component of income tax expense, and the accrued interest and penalties are included in deferred and income taxes payable in the Company's consolidated balance sheets. See Note 13 to the Company's consolidated financial statements for more information on the Company’s accounting for income taxes.
Income taxes are accounted for using an asset and liability approach that requires the recognition of deferred tax assets and liabilities for the expected future tax consequences of events that have been included in the financial statements. Under this method, deferred tax assets and liabilities are determined based on the differences between the financial statement and tax basis of assets and liabilities using enacted tax rates in effect for the year in which the differences are expected to reverse. The effect of a change in tax rates on deferred tax assets and liabilities is recognized in income in the period that includes the enactment date. A valuation allowance is provided when it is more likely than not that some portion or all of the net deferred tax assets will not be realized. The factors used to assess the likelihood of realization include the Company's forecast of the reversal of temporary differences, future taxable income, and available tax planning strategies that could be implemented to realize the net deferred tax assets. Failure to achieve forecasted taxable income in applicable tax jurisdictions could affect the ultimate realization of deferred tax assets and could result in an increase in the Company's effective tax rate on future earnings. Based on our assessment, it appears more likely than not that all of the net deferred tax assets will be realized through future taxable income.
RECENT ACCOUNTING PRONOUNCEMENTS
For a description of accounting changes and recent accounting standards, including the expected dates of adoption and estimated effects, if any, on our financial position or results of operations, see Note 2 to the Company's consolidated financial statements.
65
ITEM 7A. QUANTITATIVE AND QUALITATIVE DISCLOSURES ABOUT MARKET RISK
Market Risk
Market risk is the risk that changes in market conditions may adversely impact the value of assets or liabilities, or otherwise negatively impact earnings. The Company is exposed to market risk related to changes in commodity prices.
The Company's precious metals inventory is subject to fluctuations in market value, resulting from changes in the underlying commodity prices. Inventory purchased or borrowed by the Company is subject to price changes. Open sale and purchase commitments are subject to changes in value between the date the purchase or sale price is fixed (the trade date) and the date the metal is received or delivered (the settlement date).
To manage the volatility related to this exposure, the Company enters into precious metals commodity forward and futures contracts. Our policy is to substantially hedge our inventory position, net of open sale and purchase commitments that are subject to price risk. We similarly seek to minimize the effect of price changes on our open sale and purchase commitments through hedging activity. Inventory borrowed is considered a natural hedge, since changes in value of the metal held are offset by the obligation to return the metal to the supplier.
We generally use futures contracts for our shorter-term hedge positions, and forward contracts, which may remain open for up to six months, for our longer-term hedge positions. We have access to all of the precious metals markets, allowing us to place hedges. We also maintain relationships with major market makers in every major precious metals dealing center. We enter into these derivative contracts for the purpose of hedging substantially all of our market exposure to precious metals prices, and not for speculative purposes. As a result of these hedging strategies, we do not believe we have a material exposure to market risk.
The Company is exposed to the risk of failure of the counterparties to its derivative contracts. The Company regularly reviews the creditworthiness of its major counterparties and monitors its exposure to concentrations. The Company believes its risk of counterparty default is limited as a result of such evaluation and the short-term duration of these arrangements.
See Note 12 to the Company's consolidated financial statements, “Derivative Instruments and Hedging Transactions”.
The Company is also exposed to the changes in the spot price of gold through its investment in the XAU₮ stablecoin. A 10% increase or decrease in the spot price of gold would not have a material impact on the consolidated financial statements.
Foreign Exchange Risk
Foreign exchange risk represents exposures to changes in the values of current holdings and future cash flows denominated in currencies other than the U.S. dollar. The types of instruments exposed to this risk include foreign currency denominated receivables and payables and future cash flows in foreign currencies arising from foreign exchange transactions.
The functional currency of our foreign subsidiaries is the U.S. dollar and therefore, we do not believe our exposure to foreign exchange risk related to these entities is material.
To manage the effect of foreign currency exchange fluctuations on its sale and purchase transactions, the Company utilizes foreign currency forward contracts with maturities of generally less than one week. Because of these hedging policies, we do not believe our exposure to foreign exchange risk is material.
See Note 12 to the Company's consolidated financial statements, “Derivative Instruments and Hedging Transactions—Foreign Currency Exchange Rate Management.”
Interest Rate Risk
Our exposure to market risk for changes in interest rates relates primarily to our product financing arrangements and Trading Credit Facility. We are subject to fluctuations in interest rates based on the variable interest terms of these arrangements, and we do not utilize derivative contracts to hedge the interest rate fluctuation. See Note 15 to the Company's consolidated financial statements, "Financing Agreements".
We manage the interest rate risks related to our interest income generating activities by increasing our secured loan interest rates and finance product pricing in response to rising interest rates. While our weighted-average effective interest rates on these products only partially mitigates the effect of interest rates related to our product financing arrangements and Trading Credit Facility, we do not believe our exposure to interest rate risk is material.
66
ITEM 8. FINANCIAL STATEMENTS AND SUPPLEMENTAL DATA
Index to the Consolidated Financial Statements and Notes thereof
67
REPORT OF INDEPENDENT REGISTERED PUBLIC ACCOUNTING FIRM
Board of Directors and Stockholders
Gold.com, Inc.
Opinion on the financial statements
We have audited the accompanying consolidated balance sheets of Gold.com, Inc. (a Delaware corporation) and subsidiaries (the “Company”) as of June 30, 2026 and 2025, the related consolidated statements of income, stockholders’ equity, and cash flows for each of the three years in the period ended June 30, 2026, and the related notes (collectively referred to as the “consolidated financial statements”). In our opinion, the consolidated financial statements present fairly, in all material respects, the financial position of the Company as of June 30, 2026 and 2025, and the results of its operations and its cash flows for each of the three years in the period ended June 30, 2026, in conformity with accounting principles generally accepted in the United States of America.
We also have audited, in accordance with the standards of the Public Company Accounting Oversight Board (United States) (“PCAOB”), the Company’s internal control over financial reporting as of June 30, 2026, based on criteria established in the 2013 Internal Control—Integrated Framework issued by the Committee of Sponsoring Organizations of the Treadway Commission (“COSO”), and our report dated September 9, 2026 expressed an unqualified opinion.
Basis for opinion
These consolidated financial statements are the responsibility of the Company’s management. Our responsibility is to express an opinion on the Company’s consolidated financial statements based on our audits. We are a public accounting firm registered with the PCAOB and are required to be independent with respect to the Company in accordance with the U.S. federal securities laws and the applicable rules and regulations of the Securities and Exchange Commission and the PCAOB.
We conducted our audits in accordance with the standards of the PCAOB. Those standards require that we plan and perform the audit to obtain reasonable assurance about whether the financial statements are free of material misstatement, whether due to error or fraud. Our audits included performing procedures to assess the risks of material misstatement of the financial statements, whether due to error or fraud, and performing procedures that respond to those risks. Such procedures included examining, on a test basis, evidence regarding the amounts and disclosures in the financial statements. Our audits also included evaluating the accounting principles used and significant estimates made by management, as well as evaluating the overall presentation of the financial statements. We believe that our audits provide a reasonable basis for our opinion.
Critical audit matters
Critical audit matters are matters arising from the current period audit of the financial statements that were communicated or required to be communicated to the audit committee and that: (1) relate to accounts or disclosures that are material to the financial statements and (2) involved our especially challenging, subjective, or complex judgments. We determined that there are no critical audit matters.
/s/
We have served as the Company’s auditor since 2015.
September 9, 2026
68
REPORT OF INDEPENDENT REGISTERED PUBLIC ACCOUNTING FIRM
Board of Directors and Stockholders
Gold.com, Inc.
Opinion on internal control over financial reporting
We have audited the internal control over financial reporting of Gold.com, Inc. (a Delaware corporation) and subsidiaries (the “Company”) as of June 30, 2026, based on criteria established in the 2013 Internal Control—Integrated Framework issued by the Committee of Sponsoring Organizations of the Treadway Commission (“COSO”). In our opinion, the Company maintained, in all material respects, effective internal control over financial reporting as of June 30, 2026, based on criteria established in the 2013 Internal Control—Integrated Framework issued by COSO.
We also have audited, in accordance with the standards of the Public Company Accounting Oversight Board (United States) (“PCAOB”), the consolidated financial statements of the Company as of and for the year ended June 30, 2026, and our report dated September 9, 2026 expressed an unqualified opinion on those financial statements.
Basis for opinion
The Company’s management is responsible for maintaining effective internal control over financial reporting and for its assessment of the effectiveness of internal control over financial reporting, included in the accompanying Management’s Annual Report on Internal Control over Financial Reporting ("Management's Report"). Our responsibility is to express an opinion on the Company’s internal control over financial reporting based on our audit. We are a public accounting firm registered with the PCAOB and are required to be independent with respect to the Company in accordance with the U.S. federal securities laws and the applicable rules and regulations of the Securities and Exchange Commission and the PCAOB.
We conducted our audit in accordance with the standards of the PCAOB. Those standards require that we plan and perform the audit to obtain reasonable assurance about whether effective internal control over financial reporting was maintained in all material respects. Our audit included obtaining an understanding of internal control over financial reporting, assessing the risk that a material weakness exists, testing and evaluating the design and operating effectiveness of internal control based on the assessed risk, and performing such other procedures as we considered necessary in the circumstances. We believe that our audit provides a reasonable basis for our opinion.
Our audit of, and opinion on, the Company’s internal control over financial reporting does not include the internal control over financial reporting of Monex Deposit Company, a wholly-owned subsidiary, or Sunshine Minting, Inc., a wholly-owned subsidiary. Monex Deposit Company’s financial statements reflect total assets and revenues constituting twenty and one percent, respectively, of the related consolidated financial statement amounts as of and for the year ended June 30, 2026. Sunshine Minting, Inc.’s financial statements reflect total assets and revenues constituting two and one percent, respectively, of the related consolidated financial statement amounts as of and for the year ended June 30, 2026. As indicated in Management’s Report, Monex Deposit Company and Sunshine Minting, Inc. were acquired during 2026. Management’s assertion on the effectiveness of the Company’s internal control over financial reporting excluded internal control over financial reporting of Monex Deposit Company and Sunshine Minting, Inc.
Definition and limitations of internal control over financial reporting
A company’s internal control over financial reporting is a process designed to provide reasonable assurance regarding the reliability of financial reporting and the preparation of financial statements for external purposes in accordance with generally accepted accounting principles. A company’s internal control over financial reporting includes those policies and procedures that (1) pertain to the maintenance of records that, in reasonable detail, accurately and fairly reflect the transactions and dispositions of the assets of the company; (2) provide reasonable assurance that transactions are recorded as necessary to permit preparation of financial statements in accordance with generally accepted accounting principles, and that receipts and expenditures of the company are being made only in accordance with authorizations of management and directors of the company; and (3) provide reasonable assurance regarding prevention or timely detection of unauthorized acquisition, use, or disposition of the company’s assets that could have a material effect on the financial statements.
Because of its inherent limitations, internal control over financial reporting may not prevent or detect misstatements. Also, projections of any evaluation of effectiveness to future periods are subject to the risk that controls may become inadequate because of changes in conditions, or that the degree of compliance with the policies or procedures may deteriorate.
/s/
September 9, 2026
69
GOLD.COM, INC. AND SUBSIDIARIES
CONSOLIDATED BALANCE SHEETS
(in thousands, except for share data)
|
|
June 30, 2026 |
|
|
June 30, 2025 |
|
||
|
|
|
|
|
|
|
||
ASSETS |
|
|
|
|
|
|
||
Current assets |
|
|
|
|
|
|
||
Cash |
|
$ |
|
|
$ |
|
||
Receivables, net |
|
|
|
|
|
|
||
Derivative assets |
|
|
|
|
|
|
||
Secured loans receivable |
|
|
|
|
|
|
||
Inventories: |
|
|
|
|
|
|
||
Inventories |
|
|
|
|
|
|
||
Restricted inventories |
|
|
|
|
|
|
||
|
|
|
|
|
|
|
||
Income tax receivable |
|
|
|
|
|
|
||
Prepaid expenses and other assets |
|
|
|
|
|
|
||
Total current assets |
|
|
|
|
|
|
||
Operating lease right of use assets |
|
|
|
|
|
|
||
Property, plant, and equipment, net |
|
|
|
|
|
|
||
Goodwill |
|
|
|
|
|
|
||
Intangibles, net |
|
|
|
|
|
|
||
Long-term investments |
|
|
|
|
|
|
||
Other long-term assets |
|
|
|
|
|
|
||
Total assets |
|
$ |
|
|
$ |
|
||
LIABILITIES AND STOCKHOLDERS’ EQUITY |
|
|
|
|
|
|
||
Current liabilities |
|
|
|
|
|
|
||
Liabilities on borrowed metals |
|
$ |
|
|
$ |
|
||
Product financing arrangements |
|
|
|
|
|
|
||
Accounts payable and other payables |
|
|
|
|
|
|
||
Deferred revenue and other advances (including amounts from related parties of $ |
|
|
|
|
|
|
||
Derivative liabilities |
|
|
|
|
|
|
||
Accrued liabilities |
|
|
|
|
|
|
||
Notes payable |
|
|
|
|
|
|
||
Total current liabilities |
|
|
|
|
|
|
||
Lines of credit |
|
|
|
|
|
|
||
Notes payable |
|
|
|
|
|
|
||
Deferred tax liabilities |
|
|
|
|
|
|
||
Other liabilities |
|
|
|
|
|
|
||
Total liabilities |
|
|
|
|
|
|
||
|
|
|
|
|
|
|||
Stockholders’ equity |
|
|
|
|
|
|
||
Preferred stock, $ |
|
|
|
|
|
|
||
Common stock, par value $ |
|
|
|
|
|
|
||
Additional paid-in capital |
|
|
|
|
|
|
||
Accumulated other comprehensive income |
|
|
|
|
|
|
||
Retained earnings |
|
|
|
|
|
|
||
Total Gold.com, Inc. stockholders’ equity |
|
|
|
|
|
|
||
Noncontrolling interests |
|
|
|
|
|
|
||
Total stockholders’ equity |
|
|
|
|
|
|
||
Total liabilities and stockholders’ equity |
|
$ |
|
|
$ |
|
||
See accompanying Notes to the Consolidated Financial Statements
70
GOLD.COM, INC. AND SUBSIDIARIES
CONSOLIDATED STATEMENTS OF INCOME
(in thousands, except for share and per share data)
|
|
Year Ended June 30, |
|
|||||||||
|
|
2026 |
|
|
2025 |
|
|
2024 |
|
|||
Revenues |
|
$ |
|
|
$ |
|
|
$ |
|
|||
Cost of sales |
|
|
|
|
|
|
|
|
|
|||
Gross profit |
|
|
|
|
|
|
|
|
|
|||
Selling, general, and administrative expenses |
|
|
( |
) |
|
|
( |
) |
|
|
( |
) |
Depreciation and amortization expense |
|
|
( |
) |
|
|
( |
) |
|
|
( |
) |
Interest income |
|
|
|
|
|
|
|
|
|
|||
Interest expense |
|
|
( |
) |
|
|
( |
) |
|
|
( |
) |
Earnings (losses) from equity method investments |
|
|
|
|
|
( |
) |
|
|
|
||
Other (expense) income, net |
|
|
( |
) |
|
|
|
|
|
|
||
Remeasurement gain (loss) on pre-existing equity interests |
|
|
|
|
|
( |
) |
|
|
|
||
Gains (losses) on foreign exchange |
|
|
( |
) |
|
|
( |
) |
|
|
|
|
Net income before provision for income taxes |
|
|
|
|
|
|
|
|
|
|||
Income tax expense |
|
|
( |
) |
|
|
( |
) |
|
|
( |
) |
Net income |
|
|
|
|
|
|
|
|
|
|||
Net income (loss) attributable to noncontrolling interests |
|
|
|
|
|
( |
) |
|
|
|
||
Net income attributable to the Company |
|
$ |
|
|
$ |
|
|
$ |
|
|||
Basic and diluted net income per share attributable |
|
|
|
|
|
|
|
|
|
|||
Basic |
|
$ |
|
|
$ |
|
|
$ |
|
|||
Diluted |
|
$ |
|
|
$ |
|
|
$ |
|
|||
|
|
|
|
|
|
|
|
|
|
|||
Weighted-average shares outstanding: |
|
|
|
|
|
|
|
|
|
|||
Basic |
|
|
|
|
|
|
|
|
|
|||
Diluted |
|
|
|
|
|
|
|
|
|
|||
See accompanying Notes to the Consolidated Financial Statements
71
GOLD.COM, INC. AND SUBSIDIARIES
CONSOLIDATED STATEMENTS OF STOCKHOLDERS' EQUITY
(in thousands, except for share data)
|
Common Stock |
|
|
Additional Paid-in |
|
|
Retained |
|
|
Accumulated other comprehensive |
|
|
Treasury Stock |
|
|
Total Gold.com, Inc. Stockholders' |
|
|
Non-controlling |
|
|
Total Stockholders’ |
|
||||||||||||||||
|
Shares |
|
|
Amount |
|
|
Capital |
|
|
Earnings |
|
|
income (loss) |
|
|
Shares |
|
|
Amount |
|
|
Equity |
|
|
Interest |
|
|
Equity |
|
||||||||||
Balance, June 30, 2023 |
|
|
|
$ |
|
|
$ |
|
|
$ |
|
|
$ |
( |
) |
|
|
( |
) |
|
$ |
( |
) |
|
$ |
|
|
$ |
|
|
$ |
|
|||||||
Net income |
|
— |
|
|
|
— |
|
|
|
— |
|
|
|
|
|
|
— |
|
|
|
— |
|
|
|
— |
|
|
|
|
|
|
|
|
|
|
||||
Share-based compensation |
|
— |
|
|
|
— |
|
|
|
|
|
|
— |
|
|
|
— |
|
|
|
— |
|
|
|
— |
|
|
|
|
|
|
— |
|
|
|
|
|||
Common stock issued for acquisition |
|
— |
|
|
|
— |
|
|
|
— |
|
|
|
( |
) |
|
|
— |
|
|
|
|
|
|
|
|
|
|
|
|
— |
|
|
|
|
||||
Noncontrolling ownership contributions and adjustments |
|
— |
|
|
|
— |
|
|
|
( |
) |
|
|
— |
|
|
|
— |
|
|
|
— |
|
|
|
— |
|
|
|
( |
) |
|
|
|
|
|
|
||
Cumulative translation adjustment, net of tax |
|
— |
|
|
|
— |
|
|
|
— |
|
|
|
— |
|
|
|
|
|
|
— |
|
|
|
— |
|
|
|
|
|
|
— |
|
|
|
|
|||
Exercise of share-based awards |
|
|
|
|
|
|
|
|
|
|
— |
|
|
|
— |
|
|
|
— |
|
|
|
— |
|
|
|
|
|
|
— |
|
|
|
|
|||||
Net settlement of share-based awards |
|
|
|
|
|
|
|
( |
) |
|
|
— |
|
|
|
— |
|
|
|
— |
|
|
|
— |
|
|
|
( |
) |
|
|
— |
|
|
|
( |
) |
||
Repurchases of common stock |
|
— |
|
|
|
— |
|
|
|
— |
|
|
|
— |
|
|
|
— |
|
|
|
( |
) |
|
|
( |
) |
|
|
( |
) |
|
|
— |
|
|
|
( |
) |
Dividends declared |
|
— |
|
|
|
— |
|
|
|
|
|
|
( |
) |
|
|
— |
|
|
|
— |
|
|
|
— |
|
|
|
( |
) |
|
|
— |
|
|
|
( |
) |
|
Balance, June 30, 2024 |
|
|
|
|
|
|
|
|
|
|
|
|
|
|
|
|
( |
) |
|
|
( |
) |
|
|
|
|
|
|
|
|
|
||||||||
Net income (loss) |
|
— |
|
|
|
— |
|
|
|
— |
|
|
|
|
|
|
— |
|
|
|
— |
|
|
|
— |
|
|
|
|
|
|
( |
) |
|
|
|
|||
Share-based compensation |
|
— |
|
|
|
— |
|
|
|
|
|
|
— |
|
|
|
— |
|
|
|
— |
|
|
|
— |
|
|
|
|
|
|
— |
|
|
|
|
|||
Common stock issued for acquisition |
|
|
|
|
|
|
|
|
|
|
( |
) |
|
|
— |
|
|
|
|
|
|
|
|
|
|
|
|
— |
|
|
|
|
|||||||
Noncontrolling ownership interest acquisition |
|
— |
|
|
|
— |
|
|
|
— |
|
|
|
— |
|
|
|
— |
|
|
|
— |
|
|
|
— |
|
|
|
— |
|
|
|
|
|
|
|
||
Cumulative translation adjustment, net of tax |
|
— |
|
|
|
— |
|
|
|
— |
|
|
|
— |
|
|
|
|
|
|
— |
|
|
|
— |
|
|
|
|
|
|
— |
|
|
|
|
|||
Exercise of share-based awards |
|
|
|
|
|
|
|
|
|
|
— |
|
|
|
— |
|
|
|
— |
|
|
|
— |
|
|
|
|
|
|
— |
|
|
|
|
|||||
Net settlement of share-based awards |
|
|
|
|
|
|
|
( |
) |
|
|
— |
|
|
|
— |
|
|
|
— |
|
|
|
— |
|
|
|
( |
) |
|
|
— |
|
|
|
( |
) |
||
Repurchases of common stock |
|
— |
|
|
|
— |
|
|
|
— |
|
|
|
— |
|
|
|
— |
|
|
|
( |
) |
|
|
( |
) |
|
|
( |
) |
|
|
— |
|
|
|
( |
) |
Repurchases of common stock - related party |
|
— |
|
|
|
— |
|
|
|
— |
|
|
|
— |
|
|
|
— |
|
|
|
( |
) |
|
|
( |
) |
|
|
( |
) |
|
|
— |
|
|
|
( |
) |
Dividends declared |
|
— |
|
|
|
— |
|
|
|
|
|
|
( |
) |
|
|
— |
|
|
|
— |
|
|
|
— |
|
|
|
( |
) |
|
|
— |
|
|
|
( |
) |
|
Balance, June 30, 2025 |
|
|
|
|
|
|
|
|
|
|
|
|
|
|
|
|
— |
|
|
|
— |
|
|
|
|
|
|
|
|
|
|
||||||||
Net income |
|
— |
|
|
|
— |
|
|
|
— |
|
|
|
|
|
|
— |
|
|
|
— |
|
|
|
— |
|
|
|
|
|
|
|
|
|
|
||||
Noncontrolling ownership interest acquisition |
|
— |
|
|
|
— |
|
|
|
— |
|
|
|
— |
|
|
|
— |
|
|
|
— |
|
|
|
— |
|
|
|
— |
|
|
|
|
|
|
|
||
Share-based compensation |
|
— |
|
|
|
— |
|
|
|
|
|
|
— |
|
|
|
— |
|
|
|
— |
|
|
|
— |
|
|
|
|
|
|
— |
|
|
|
|
|||
Common stock issued for acquisition |
|
|
|
|
|
|
|
|
|
|
— |
|
|
|
— |
|
|
|
— |
|
|
|
— |
|
|
|
|
|
|
— |
|
|
|
|
|||||
Common stock issued in private placement, net of offering costs |
|
|
|
|
|
|
|
|
|
|
— |
|
|
|
— |
|
|
|
— |
|
|
|
— |
|
|
|
|
|
|
— |
|
|
|
|
|||||
Cumulative translation adjustment, net of tax |
|
— |
|
|
|
— |
|
|
|
— |
|
|
|
— |
|
|
|
( |
) |
|
|
— |
|
|
|
— |
|
|
|
( |
) |
|
|
— |
|
|
|
( |
) |
Exercise of share-based awards |
|
|
|
|
|
|
|
|
|
|
— |
|
|
|
— |
|
|
|
— |
|
|
|
— |
|
|
|
|
|
|
— |
|
|
|
|
|||||
Net settlement of share-based awards |
|
|
|
|
— |
|
|
|
( |
) |
|
|
— |
|
|
|
— |
|
|
|
— |
|
|
|
— |
|
|
|
( |
) |
|
|
— |
|
|
|
( |
) |
|
Dividends declared |
|
— |
|
|
|
— |
|
|
|
|
|
|
( |
) |
|
|
— |
|
|
|
— |
|
|
|
— |
|
|
|
( |
) |
|
|
— |
|
|
|
( |
) |
|
Balance, June 30, 2026 |
|
|
|
$ |
|
|
$ |
|
|
$ |
|
|
$ |
|
|
|
|
|
$ |
|
|
$ |
|
|
$ |
|
|
$ |
|
||||||||||
See accompanying Notes to the Consolidated Financial Statements
72
GOLD.COM, INC. AND SUBSIDIARIES
CONSOLIDATED STATEMENTS OF CASH FLOWS
(in thousands)
|
|
Year Ended June 30, |
|
|||||||||
|
|
2026 |
|
|
2025 |
|
|
2024 |
|
|||
Cash flows from operating activities: |
|
|
|
|
|
|
|
|
|
|||
Net income |
|
$ |
|
|
$ |
|
|
$ |
|
|||
Adjustments to reconcile net income to net cash flows from operating activities: |
|
|
|
|
|
|
|
|
|
|||
Depreciation and amortization |
|
|
|
|
|
|
|
|
|
|||
Amortization of loan cost |
|
|
|
|
|
|
|
|
|
|||
Share-based compensation |
|
|
|
|
|
|
|
|
|
|||
Remeasurement (gain) loss on pre-existing equity interests |
|
|
( |
) |
|
|
|
|
|
( |
) |
|
Losses (earnings) from equity method investments |
|
|
( |
) |
|
|
|
|
|
( |
) |
|
Other |
|
|
|
|
|
( |
) |
|
|
( |
) |
|
Changes in assets and liabilities: |
|
|
|
|
|
|
|
|
|
|||
Receivables, net |
|
|
( |
) |
|
|
( |
) |
|
|
|
|
Secured loans made to affiliates |
|
|
|
|
|
|
|
|
|
|||
Derivative assets |
|
|
( |
) |
|
|
( |
) |
|
|
( |
) |
Income tax receivable |
|
|
|
|
|
( |
) |
|
|
|
||
Precious metals held under financing arrangements |
|
|
|
|
|
|
|
|
|
|||
Inventories |
|
|
( |
) |
|
|
( |
) |
|
|
( |
) |
Prepaid expenses and other assets |
|
|
( |
) |
|
|
( |
) |
|
|
( |
) |
Accounts payable and other payables |
|
|
|
|
|
( |
) |
|
|
( |
) |
|
Deferred revenue and other advances (including amounts from related parties of $ |
|
|
|
|
|
|
|
|
|
|||
Derivative liabilities |
|
|
( |
) |
|
|
|
|
|
|
||
Liabilities on borrowed metals |
|
|
( |
) |
|
|
|
|
|
|
||
Accrued liabilities |
|
|
|
|
|
( |
) |
|
|
( |
) |
|
Income tax payable |
|
|
|
|
|
|
|
|
( |
) |
||
Net cash provided by operating activities |
|
|
|
|
|
|
|
|
|
|||
Cash flows from investing activities: |
|
|
|
|
|
|
|
|
|
|||
Capital expenditures for property, plant, and equipment |
|
|
( |
) |
|
|
( |
) |
|
|
( |
) |
Acquisition of businesses, net of cash acquired |
|
|
( |
) |
|
|
( |
) |
|
|
( |
) |
Purchase of long-term investments |
|
|
( |
) |
|
|
|
|
|
( |
) |
|
Purchase of stablecoin |
|
|
( |
) |
|
|
|
|
|
|
||
Purchase of intangible assets |
|
|
( |
) |
|
|
|
|
|
( |
) |
|
Secured loans receivable, net |
|
|
( |
) |
|
|
|
|
|
( |
) |
|
Purchase of marketable securities |
|
|
|
|
|
( |
) |
|
|
|
||
Proceeds from sale of marketable securities |
|
|
|
|
|
|
|
|
|
|||
Other |
|
|
|
|
|
( |
) |
|
|
( |
) |
|
Net cash used in investing activities |
|
|
( |
) |
|
|
( |
) |
|
|
( |
) |
Cash flows from financing activities: |
|
|
|
|
|
|
|
|
|
|||
Product financing arrangements, net |
|
|
( |
) |
|
|
( |
) |
|
|
|
|
Dividends paid |
|
|
( |
) |
|
|
( |
) |
|
|
( |
) |
Borrowings under lines of credit |
|
|
|
|
|
|
|
|
|
|||
Repayments under lines of credit |
|
|
( |
) |
|
|
( |
) |
|
|
( |
) |
Repayment of notes |
|
|
|
|
|
( |
) |
|
|
( |
) |
|
Proceeds from notes payable to related party |
|
|
|
|
|
|
|
|
|
|||
Repayments on notes payable to related party |
|
|
|
|
|
( |
) |
|
|
|
||
Net proceeds from the issuance of common stock |
|
|
|
|
|
|
|
|
|
|||
Repurchases of common stock |
|
|
|
|
|
( |
) |
|
|
( |
) |
|
Repurchases of common stock from a related party |
|
|
|
|
|
( |
) |
|
|
|
||
Debt funding issuance costs |
|
|
( |
) |
|
|
( |
) |
|
|
( |
) |
Proceeds from the exercise of share-based awards |
|
|
|
|
|
|
|
|
|
|||
Payments for tax withholding related to net settlement of share-based awards |
|
|
( |
) |
|
|
( |
) |
|
|
( |
) |
Other |
|
|
( |
) |
|
|
|
|
|
|
||
Net cash (used in) provided by financing activities |
|
|
( |
) |
|
|
( |
) |
|
|
|
|
Net increase in cash |
|
|
|
|
|
|
|
|
|
|||
Cash, beginning of period |
|
|
|
|
|
|
|
|
|
|||
Cash, end of period |
|
$ |
|
|
$ |
|
|
$ |
|
|||
Supplemental disclosures of cash flow information: |
|
|
|
|
|
|
|
|
|
|||
Cash paid during the period for: |
|
|
|
|
|
|
|
|
|
|||
Interest paid |
|
$ |
|
|
$ |
|
|
$ |
|
|||
Non-cash investing and financing activities: |
|
|
|
|
|
|
|
|
|
|||
Property, plant, and equipment acquired on account |
|
$ |
|
|
$ |
|
|
$ |
|
|||
Common stock issued for acquisitions |
|
$ |
|
|
$ |
|
|
$ |
|
|||
Loss on reissuance of treasury stock |
|
$ |
|
|
$ |
|
|
$ |
|
|||
Addition of right of use assets under lease obligations |
|
$ |
|
|
$ |
|
|
$ |
|
|||
Contingent consideration payable for acquisition of business |
|
$ |
|
|
$ |
|
|
$ |
|
|||
See accompanying Notes to the Consolidated Financial Statements
73
GOLD.COM, INC. AND SUBSIDIARIES
NOTES TO THE CONSOLIDATED FINANCIAL STATEMENTS
1. DESCRIPTION OF BUSINESS
Basis of Presentation
The consolidated financial statements comprise those of Gold.com, Inc. (also referred to as "we", "us", the "Company", and "Gold.com"), its consolidated subsidiaries, and its joint ventures in which the Company has a controlling interest. Prior to December 2025, Gold.com, Inc. was operating as A-Mark Precious Metals, Inc.
Business Segments
The Company conducts its operations in
Wholesale Sales & Ancillary Services
The Company operates its Wholesale Sales & Ancillary Services segment directly under the "A-Mark" brand and through its consolidated subsidiaries, A-Mark Trading AG (“AMTAG”), Transcontinental Depository Services, LLC ("TDS"), A-M Global Logistics, LLC (“AMGL” or "Logistics"), AM&ST Associates, LLC ("AMST" or the "Silver Towne Mint"), AM/LPM Ventures, LLC, which owns a majority interest in LPM Group Limited ("LPM"), Spectrum Group International, LLC, which was formed in February 2025 to acquire all of the stock of Spectrum Group International, Inc. ("SGI"), Pinehurst Coin Exchange, Inc. ("Pinehurst"), AM Precious Metals Singapore PTE Ltd., and Sunshine Minting, Inc. ("SMI").
The Wholesale Sales & Ancillary Services segment operates as a full-service precious metals company. We offer gold, silver, platinum, and palladium in the form of bars, plates, powder, wafers, grain, ingots, and coins. We sell of coin and bar products in a variety of weights, shapes, and sizes for distribution to dealers and other qualified purchasers. We have a marketing and numismatics showroom in Hong Kong and a trading center in Costa Mesa, California. The trading center for buying and selling precious metals is available to receive orders 24 hours every day, even when many major world commodity markets are closed. We offer our customers a variety of ancillary services, including financing, storage, consignment, logistics, and various customized financial programs. As a U.S. Mint-authorized purchaser of gold, silver, platinum, and palladium coins, we purchase product directly from the U.S. Mint, and also purchase product from other sovereign mints, for sale to our customers.
We previously marketed our goods and services to international markets through our AMTAG subsidiary, which operated an overseas office in Vienna, Austria since 2009. We decided to close our office in Vienna effective early fiscal 2027 and have begun the process to dissolve AMTAG. Marketing operations previously conducted in Vienna have been shifted to other company offices.
Through its wholly-owned subsidiary TDS, the Company offers a variety of managed storage options for precious metals products to financial institutions, dealers, investors, and collectors around the world.
The Company's wholly-owned subsidiary AMGL is based in Las Vegas, Nevada, and provides our customers an array of complementary services, including receiving, handling, inventorying, processing, packing, and shipping of precious metals and custom coins securely.
Through its wholly-owned subsidiary AMST, the Company designs and produces minted silver products. Our Silver Towne Mint operations allow us to provide greater product selection to our customers as well as to gain increased access to silver during volatile market environments, which have historically created higher demand for precious metals products.
The Company operates LPM, its Asia headquarters, through its subsidiary AM/LPM Ventures, LLC. Based in Hong Kong, LPM offers the Company's full-service precious metals products and services in Asia and internationally.
Spectrum Group International, LLC
In February 2025, we acquired
74
Total consideration to acquire SGI was $
Concurrently with the acquisition of SGI, we issued equity awards to key SGI management.
We incurred $
Assets acquired and liabilities assumed were recorded based on valuations derived from estimated fair value assessment and assumptions. While we believe that our estimates and assumptions underlying the valuations are reasonable, different estimates or assumptions could result in different valuations assigned to the individual assets acquired and liabilities assumed, and the resulting amount of goodwill.
Cash |
|
|
|
|
$ |
|
|
|
Common stock |
|
|
|
|
|
|
|
|
Holdback consideration - common stock |
|
|
|
|
|
|
|
|
Repayment of debt |
|
|
|
|
|
|
|
|
Settlement of pre-existing payables |
|
|
|
|
|
|
|
|
Noncontrolling interest |
|
|
|
|
|
|
|
|
Total purchase price |
|
|
|
|
$ |
|
|
|
|
|
|
|
|
|
|
|
|
Cash |
|
|
|
|
$ |
|
|
|
Receivables, net |
|
|
|
|
|
|
|
|
Inventories |
|
|
|
|
|
|
|
|
Other current assets |
|
|
|
|
|
|
|
|
Property, plant, and equipment, net |
|
|
|
|
|
|
|
|
Operating lease right of use assets |
|
|
|
|
|
|
|
|
Trade names |
|
|
|
|
|
|
|
|
In-process research and development |
|
|
|
|
|
|
|
|
Developed technology |
|
|
|
|
|
|
|
|
Existing customer relationships |
|
|
|
|
|
|
|
|
Other long-term assets |
|
|
|
|
|
|
|
|
Total identifiable assets acquired |
|
|
|
|
|
|
|
|
Product financing arrangements |
|
|
|
|
|
( |
) |
|
Accounts payable and other payables |
|
|
|
|
|
( |
) |
|
Deferred revenue and other advances |
|
|
|
|
|
( |
) |
|
Accrued liabilities |
|
|
|
|
|
( |
) |
|
Operating lease liability |
|
|
|
|
|
( |
) |
|
Other liabilities |
|
|
|
|
|
( |
) |
|
Net identifiable assets acquired |
|
|
|
|
|
|
|
|
Goodwill |
|
|
|
|
|
|
|
|
Total purchase price |
|
|
|
|
$ |
|
|
|
We accounted for the acquisition of SGI as a business combination and determined that (i) SGI was a business which combines inputs and processes to create outputs, and (ii) substantially all of the fair value of gross assets acquired was not concentrated in a single identifiable asset or group of similar identifiable assets.
We measured the identifiable assets and liabilities assumed at their acquisition date fair values separately from goodwill. Through the acquisition of SGI, we acquired intangible assets representing existing customer relationships, developed technology, in-process research and development ("IPR&D") and trade names. The existing customer relationships and developed technology acquired were determined to have weighted-average useful lives of
75
Goodwill represents the excess of the purchase price over the fair value of the net tangible and intangible assets acquired. The acquisition of SGI resulted in the recognition of $
The following unaudited pro forma consolidated results of operations for the years ended June 30, 2025 and 2024 assumes that the acquisition of SGI occurred as of July 1, 2023 (in thousands):
|
|
|
Year Ended June 30, |
|
|||||
|
|
|
2025 |
|
|
2024 |
|
||
Revenues |
|
|
$ |
|
|
$ |
|
||
Net income |
|
|
$ |
|
|
$ |
|
||
The above pro forma supplemental information does not purport to be indicative of what the Company's operations would have been had the acquisition occurred on July 1, 2023, and should not be considered indicative of future operating results. The Company believes the assumptions used provide a reasonable basis for reflecting the significant pro forma effects directly attributable to the acquisition of SGI. The unaudited pro forma information accounts for: (i) the elimination of transactions between the Company and SGI, and (ii) adjustments to the amortization expense resulting from the estimated fair value of the acquired finite-lived intangible assets, acquisition costs, compensation expenses, and the resulting impact to the income tax provision.
Pinehurst
In 2019, the Company acquired its initial
The acquisition of the controlling interest in Pinehurst was accounted for as a business combination achieved in stages. As a result of the change in control, the Company was required to remeasure its pre-existing equity investment in Pinehurst at fair value prior to consolidation. We estimated the fair value of our
The value of the pre-existing equity as of the acquisition date was based on a valuation derived from estimated fair value assessments and assumptions. These fair value assessments were determined using a market approach.
Concurrently with the acquisition of Pinehurst, we assumed a promissory note for $
We incurred $
We may be required to pay contingent consideration up to $
76
Assets acquired and liabilities assumed were recorded based on valuations derived from estimated fair value assessment and assumptions. While we believe that our estimates and assumptions underlying the valuations are reasonable, different estimates or assumptions could result in different valuations assigned to the individual assets acquired and liabilities assumed, and the resulting amount of goodwill.
Cash |
|
|
|
|
$ |
|
|
|
Pre-existing equity method investment |
|
|
|
|
|
|
|
|
Repayment of debt |
|
|
|
|
|
|
|
|
Contingent consideration |
|
|
|
|
|
|
|
|
Settlement of pre-existing receivables |
|
|
|
|
|
( |
) |
|
Total purchase price |
|
|
|
|
$ |
|
|
|
|
|
|
|
|
|
|
|
|
Cash |
|
|
|
|
$ |
|
|
|
Receivables, net |
|
|
|
|
|
|
|
|
Inventories |
|
|
|
|
|
|
|
|
Other current assets |
|
|
|
|
|
|
|
|
Property, plant, and equipment, net |
|
|
|
|
|
|
|
|
Operating lease right of use asset |
|
|
|
|
|
|
|
|
Trade names |
|
|
|
|
|
|
|
|
Existing customer relationships |
|
|
|
|
|
|
|
|
Total identifiable assets acquired |
|
|
|
|
|
|
|
|
Accounts payable and other payables |
|
|
|
|
|
( |
) |
|
Deferred revenue and other advances |
|
|
|
|
|
( |
) |
|
Accrued liabilities |
|
|
|
|
|
( |
) |
|
Operating lease liability |
|
|
|
|
|
( |
) |
|
Other liabilities |
|
|
|
|
|
( |
) |
|
Net identifiable assets acquired |
|
|
|
|
|
|
|
|
Goodwill |
|
|
|
|
|
|
|
|
Total purchase price |
|
|
|
|
$ |
|
|
|
We accounted for the acquisition of Pinehurst as a business combination and determined that (i) Pinehurst was a business which combines inputs and processes to create outputs, and (ii) substantially all of the fair value of gross assets acquired was not concentrated in a single identifiable asset or group of similar identifiable assets.
We measured the identifiable assets and liabilities assumed at their acquisition date fair values separately from goodwill. Through the acquisition of Pinehurst, we acquired intangible assets representing existing customer relationships and trade names. The existing customer relationships acquired were determined to have a weighted-average useful life of
Goodwill represents the excess of the purchase price over the fair value of the net tangible and intangible assets acquired. The acquisition of Pinehurst resulted in the recognition of $
The following unaudited pro forma consolidated results of operations for the years ended June 30, 2025 and 2024 assumes that the acquisition of Pinehurst occurred as of July 1, 2023 (in thousands):
|
|
|
Year Ended June 30, |
|
|||||
|
|
|
2025 |
|
|
2024 |
|
||
Revenues |
|
|
$ |
|
|
$ |
|
||
Net income |
|
|
$ |
|
|
$ |
|
||
The above pro forma supplemental information does not purport to be indicative of what the Company's operations would have been had the acquisition occurred on July 1, 2023, and should not be considered indicative of future operating results. The Company believes the assumptions used provide a reasonable basis for reflecting the significant pro forma effects directly attributable to the acquisition of Pinehurst. The unaudited pro forma information accounts for: (i) the elimination of transactions between the Company and Pinehurst, and (ii) adjustments to the amortization expense resulting from the estimated fair value of the acquired finite-lived intangible assets, acquisition costs, compensation expenses, remeasurement losses, and the resulting impact to the income tax provision.
77
Sunshine Minting
In December 2020, the Company acquired
The acquisition of the controlling interest in SMI was accounted for as a business combination achieved in stages. As a result of the change in control, the Company was required to remeasure its pre-existing equity investment in SMI at fair value prior to consolidation. We estimated the fair value of our
Concurrently with the acquisition of SMI, we entered into a consulting agreement with former majority owner of SMI through March 2029.
The transaction costs related to the acquisition of SMI were not significant. The financial results of SMI were included in our consolidated financial statements as of the acquisition date as part of our Wholesale Sales & Ancillary Services segment; these amounts were not material to our consolidated financial statements.
Assets acquired and liabilities assumed were recorded based on valuations derived from estimated fair value assessment and assumptions. While we believe that our estimates and assumptions underlying the valuations are reasonable, different estimates or assumptions could result in different valuations assigned to the individual assets acquired and liabilities assumed, and the resulting amount of goodwill.
Cash |
|
|
|
|
$ |
|
|
|
Pre-existing equity method investment |
|
|
|
|
|
|
|
|
Noncontrolling interest |
|
|
|
|
|
|
|
|
Total purchase price |
|
|
|
|
$ |
|
|
|
|
|
|
|
|
|
|
|
|
Cash |
|
|
|
|
$ |
|
|
|
Receivables, net |
|
|
|
|
|
|
|
|
Inventories |
|
|
|
|
|
|
|
|
Other current assets |
|
|
|
|
|
|
|
|
Property, plant, and equipment, net |
|
|
|
|
|
|
|
|
Operating lease right of use assets |
|
|
|
|
|
|
|
|
Assets held for sale |
|
|
|
|
|
|
|
|
Trade names |
|
|
|
|
|
|
|
|
Existing customer relationships |
|
|
|
|
|
|
|
|
Proprietary knowhow |
|
|
|
|
|
|
|
|
Other assets |
|
|
|
|
|
|
|
|
Total identifiable assets acquired |
|
|
|
|
|
|
|
|
Accounts payable and other payables |
|
|
|
|
|
( |
) |
|
Accrued liabilities |
|
|
|
|
|
( |
) |
|
Deferred tax liabilities |
|
|
|
|
|
( |
) |
|
Operating lease liabilities |
|
|
|
|
|
( |
) |
|
Other liabilities |
|
|
|
|
|
( |
) |
|
Net identifiable assets acquired |
|
|
|
|
|
|
|
|
Goodwill |
|
|
|
|
|
|
|
|
Total purchase price |
|
|
|
|
$ |
|
|
|
We accounted for the acquisition of SMI as a business combination and determined that (i) SMI was a business which combines inputs and processes to create outputs, and (ii) substantially all of the fair value of gross assets acquired was not concentrated in a single identifiable asset or group of similar identifiable assets.
Our purchase price allocation for the acquisition of SMI is preliminary and subject to revision as additional information about fair value of assets and liabilities becomes available, primarily related to information pertaining to working capital and tax balances. Additional information that existed as of the acquisition date but at the time was unknown to us may become known to us during the remainder of the remeasurement period, a period not to exceed 12 months from the acquisition date.
78
We measured the identifiable assets and liabilities assumed at their acquisition date fair values separately from goodwill. Through the acquisition of SMI, we acquired intangible assets representing existing customer relationships, proprietary knowhow, and trade names. The existing customer relationships and the proprietary knowhow acquired were determined to have a useful life of
The Company acquired a building through its acquisition of SMI that was classified as held for sale as of the acquisition date. In June 2026, the Company sold this building at the recorded value upon acquisition resulting in
Goodwill represents the excess of the purchase price over the fair value of the net tangible and intangible assets acquired. The acquisition of SMI resulted in the recognition of $
The following unaudited pro forma consolidated results of operations for the year ended June 30, 2026 and 2025 assumes that the acquisition of SMI occurred as of July 1, 2024 (in thousands):
|
|
Year Ended June 30, |
|
|||||
|
|
2026 |
|
|
2025 |
|
||
Revenues |
|
$ |
|
|
$ |
|
||
Net income |
|
$ |
|
|
$ |
|
||
The above pro forma supplemental information does not purport to be indicative of what the Company's operations would have been had the acquisition occurred on July 1, 2024, and should not be considered indicative of future operating results. The Company believes the assumptions used provide a reasonable basis for reflecting the significant pro forma effects directly attributable to the acquisition of SMI. The unaudited pro forma information accounts for: (i) the elimination of transactions between the Company and SMI, and (ii) adjustments to the amortization expense resulting from the estimated fair value of the acquired finite-lived intangible assets, and the resulting impact to the income tax provision.
Direct-to-Consumer
The Company operates its Direct-to-Consumer segment through its wholly-owned subsidiaries JM Bullion, Inc. (“JMB”), Goldline, Inc. (“Goldline”), SGI, Pinehurst, AMS Holding, LLC ("AMS"), AM LPM Singapore PTE Ltd., Monex Deposit Company ("Monex") and through its investment in Silver Gold Bull, Inc. ("SGB"). As of June 30, 2026, JMB had several wholly-owned subsidiaries, including: Buy Gold and Silver Corp. ("BGASC"), BX Corporation ("BullionMax"), Gold Price Group, Inc. (“GPG”), Silver.com, Inc. (“Silver.com”), Provident Metals Corp. (“PMC”), and CyberMetals Corp. ("CyberMetals"). Goldline, Inc. owns 100% of AM IP Assets, LLC ("AMIP"). SGB and Goldline each have a
JM Bullion, Inc.
JMB is a leading e-commerce retailer providing access to a broad array of gold, silver, copper, platinum, and palladium products through its websites. JMB owns and operates numerous websites targeting specific niches within the precious metals retail market, including JMBullion.com, ProvidentMetals.com, Silver.com, CyberMetals.com, GoldPrice.org, SilverPrice.org, BGASC.com, BullionMax.com, and Gold.com. Typically, JMB offers approximately
In April 2022, JMB commercially launched the CyberMetals online platform, where customers can purchase and sell fractional shares of digital gold, silver, platinum, and palladium bars in a range of denominations. CyberMetals’ customers have the option to convert their digital holdings to fabricated precious metals products via an integrated redemption flow with JMB. These products may be designated by the customer for storage by the Company or shipped directly to the customer.
Goldline, Inc.
The Company acquired Goldline in August 2017 through an asset purchase transaction with Goldline, LLC, which had been in operation since 1960. Goldline is a direct retailer of precious metals to the investor community, and markets its precious metal products on television, radio, and the internet, as well as through customer service outreach. Goldline’s subsidiary AMIP manages its intellectual property. PMPP was formed in fiscal 2019 pursuant to terms of a joint venture agreement with SGB, for the purpose of purchasing precious metals from the partners' retail customers, and then reselling the acquired products back to affiliates of the partners. PMPP commenced its operations in fiscal 2020.
79
Silver Gold Bull, Inc.
In 2014, the Company acquired its initial ownership interest in SGB, a leading e-commerce precious metals retailer in Canada. Through its website, SilverGoldBull.com, SGB offers a variety of products from gold, silver, platinum, and palladium in the form of bars, coins and rounds, as well as certified coins from mints around the world. In 2018 and 2022, the Company made incremental investments to increase its ownership interest in SGB to
In June 2024, SGB declared a $
Spectrum Group International, LLC
SGI, which we acquired in February 2025, is the parent company of Stack's Bowers Galleries, which is one of the world's largest rare coin and currency auction houses and a leading wholesale and retail dealer specializing in numismatic and bullion products. Its auction services unit conducts in-person, internet and specialized auctions of consigned and owned items and has sold a wide range of the most important rarities and numismatic collections over its distinguished history. SGI's financial results attributable to its wholesale operations are included in our Wholesale Sales & Ancillary Services segment, and the financial results attributable to its auction and retail operations are included in our Direct-to-Consumer segment.
Pinehurst Coin Exchange, Inc.
In February 2025, the Company acquired the remaining outstanding equity interests in Pinehurst it did not previously own. Pinehurst is a leading precious metals broker that services the wholesale and retail marketplace and is one of the nation’s largest e-commerce retailers of modern and numismatic coins on eBay. Pinehurst operates the www.PinehurstCoins.com and www.ModernCoinMart.com websites. Pinehurst's financial results attributable to its wholesale operations are included in our Wholesale Sales & Ancillary Services segment, and the financial results attributable to its retail operations are included in our Direct-to-Consumer segment.
AMS Holding, LLC
On April 1, 2025, the Company acquired the
The acquisition of the controlling interest in AMS was accounted for as a business combination achieved in stages. As a result of the change in control, the Company was required to remeasure its pre-existing equity investment in AMS at fair value prior to consolidation. We estimated the fair value of our
Concurrent with the acquisition of AMS, we issued equity awards to key AMS management.
We incurred $
We may be required to pay contingent consideration of up to an additional $
80
Assets acquired and liabilities assumed were recorded based on valuations derived from estimated fair value assessment and assumptions. While we believe that our estimates and assumptions underlying the valuations are reasonable, different estimates or assumptions could result in different valuations assigned to the individual assets acquired and liabilities assumed, and the resulting amount of goodwill.
Cash |
|
|
|
|
$ |
|
|
|
Pre-existing equity method investment |
|
|
|
|
|
|
|
|
Contingent consideration |
|
|
|
|
|
|
|
|
Settlement of pre-existing liabilities |
|
|
|
|
|
|
|
|
Total purchase price |
|
|
|
|
$ |
|
|
|
|
|
|
|
|
|
|
|
|
Cash |
|
|
|
|
$ |
|
|
|
Receivables, net |
|
|
|
|
|
|
|
|
Inventories |
|
|
|
|
|
|
|
|
Other current assets |
|
|
|
|
|
|
|
|
Property, plant, and equipment, net |
|
|
|
|
|
|
|
|
Operating lease right of use asset |
|
|
|
|
|
|
|
|
Trade names |
|
|
|
|
|
|
|
|
Existing customer relationships |
|
|
|
|
|
|
|
|
Other assets |
|
|
|
|
|
|
|
|
Total identifiable assets acquired |
|
|
|
|
|
|
|
|
Accounts payable and other payables |
|
|
|
|
|
( |
) |
|
Deferred revenue and other advances |
|
|
|
|
|
( |
) |
|
Accrued liabilities |
|
|
|
|
|
( |
) |
|
Operating lease liability |
|
|
|
|
|
( |
) |
|
Other liabilities |
|
|
|
|
|
( |
) |
|
Net identifiable assets acquired |
|
|
|
|
|
|
|
|
Goodwill |
|
|
|
|
|
|
|
|
Total purchase price |
|
|
|
|
$ |
|
|
|
We accounted for the acquisition of AMS as a business combination and determined that (i) AMS was a business which combines inputs and processes to create outputs, and (ii) substantially all of the fair value of gross assets acquired was not concentrated in a single identifiable asset or group of similar identifiable assets.
We measured the identifiable assets and liabilities assumed at their acquisition date fair values separately from goodwill. Through the acquisition of AMS, we acquired intangible assets representing existing customer relationships and trade names. The existing customer relationships acquired were determined to have a useful life of
Goodwill represents the excess of the purchase price over the fair value of the net tangible and intangible assets acquired. The acquisition of AMS resulted in the recognition of $
The following unaudited pro forma consolidated results of operations for the years ended June 30, 2025 and 2024 assumes that the acquisition of AMS occurred as of July 1, 2023 (in thousands):
|
|
|
Year Ended June 30, |
|
|||||
|
|
|
2025 |
|
|
2024 |
|
||
Revenues |
|
|
$ |
|
|
$ |
|
||
Net (loss) income |
|
|
$ |
( |
) |
|
$ |
|
|
The above pro forma supplemental information does not purport to be indicative of what the Company's operations would have been had the transaction occurred on July 1, 2023, and should not be considered indicative of future operating results. The Company believes the assumptions used provide a reasonable basis for reflecting the significant pro forma effects directly attributable to the acquisition of AMS. The unaudited pro forma information accounts for: (i) the elimination of transactions between the Company and AMS and (ii) adjustments to the amortization expense resulting from the estimated fair value of the acquired finite-lived intangible assets, acquisition costs, cash and share-based compensation expense, remeasurement gains, and the resulting impact to the income tax provision.
81
Monex
In November 2025, the Company entered into a definitive agreement to acquire, through a wholly-owned subsidiary, all of the equity interests of Monex Deposit Company, a California limited liability company, and certain related entities ("Monex"). Monex was founded in 1987 and is a leading precious metals dealer providing investors with access to gold, silver, platinum and palladium through a full-service platform along with secure vault storage. The Company's acquisition of Monex was consummated in January 2026. The purchase price paid by the Company was $
The transaction costs related to the acquisition of Monex were not significant. The financial results of Monex were included in our consolidated financial statements as of the acquisition date as part of our Direct-to-Consumer segment; these amounts were not material to our consolidated financial statements.
We may be required to pay contingent consideration up to $
Assets acquired and liabilities assumed were recorded based on valuations derived from estimated fair value assessment and assumptions. While we believe that our estimates and assumptions underlying the valuations are reasonable, different estimates or assumptions could result in different valuations assigned to the individual assets acquired and liabilities assumed, and the resulting amount of goodwill.
Cash |
|
|
|
|
$ |
|
|
|
Contingent consideration |
|
|
|
|
|
|
|
|
Common stock |
|
|
|
|
|
|
|
|
Settlement of pre-existing payables due to the Company |
|
|
|
|
|
|
|
|
Total purchase price |
|
|
|
|
$ |
|
|
|
|
|
|
|
|
|
|
|
|
Cash |
|
|
|
|
$ |
|
|
|
Receivables, net |
|
|
|
|
|
|
|
|
Derivative assets |
|
|
|
|
|
|
|
|
Inventories: |
|
|
|
|
|
|
|
|
Inventories |
|
|
|
|
|
|
|
|
Restricted inventories |
|
|
|
|
|
|
|
|
|
|
|
|
|
|
|
|
|
Other current assets |
|
|
|
|
|
|
|
|
Property, plant, and equipment, net |
|
|
|
|
|
|
|
|
Operating lease right of use assets |
|
|
|
|
|
|
|
|
Trade names |
|
|
|
|
|
|
|
|
Developed technology |
|
|
|
|
|
|
|
|
Existing customer relationships |
|
|
|
|
|
|
|
|
Other long-term assets |
|
|
|
|
|
|
|
|
Total identifiable assets acquired |
|
|
|
|
|
|
|
|
Liabilities on borrowed metals |
|
|
|
|
|
( |
) |
|
Accounts payable and other payables |
|
|
|
|
|
( |
) |
|
Deferred revenue and other advances |
|
|
|
|
|
( |
) |
|
Accrued liabilities |
|
|
|
|
|
( |
) |
|
Operating lease liability |
|
|
|
|
|
( |
) |
|
Net identifiable assets acquired |
|
|
|
|
|
|
|
|
Goodwill |
|
|
|
|
|
|
|
|
Total purchase price |
|
|
|
|
$ |
|
|
|
We accounted for the acquisition of Monex as a business combination and determined that (i) Monex was a business which combines inputs and processes to create outputs, and (ii) substantially all of the fair value of gross assets acquired was not concentrated in a single identifiable asset or group of similar identifiable assets.
82
Our purchase price allocation for the acquisition of Monex is preliminary and subject to revision as additional information about fair value of assets and liabilities becomes available, primarily related to information pertaining to working capital and tax balances. Additional information that existed as of the acquisition date but at the time was unknown to us may become known to us during the remainder of the remeasurement period, a period not to exceed 12 months from the acquisition date.
We measured the identifiable assets and liabilities assumed at their acquisition date fair values separately from goodwill. Through the acquisition of Monex, we acquired intangible assets representing existing customer relationships, developed technology, and trade names. The existing customer relationships and developed technology acquired were determined to have useful lives of
Goodwill represents the excess of the purchase price over the fair value of the net tangible and intangible assets acquired. The acquisition of Monex resulted in the recognition of $
Secured Lending
The Company operates its Secured Lending segment through its wholly-owned subsidiary, Collateral Finance Corporation, LLC, including its wholly-owned subsidiary, CFC Alternative Investments (“CAI”) (collectively “CFC”).
CFC is a California licensed finance lender that originates and acquires commercial loans secured primarily by bullion and numismatic coins. CFC's customers include coin and precious metal dealers, investors, and collectors.
CAI is a holding company that has a
2. SUMMARY OF SIGNIFICANT ACCOUNTING POLICIES
Principles of Consolidation
The consolidated financial statements reflect the financial condition, results of operations, statements of stockholders’ equity, and cash flows of the Company, and were prepared using accounting principles generally accepted in the United States (“U.S. GAAP”). The Company consolidates its subsidiaries that are wholly-owned, and majority owned, and entities that are variable interest entities where the Company is determined to be the primary beneficiary. Our consolidated financial statements also include the accounts of: AMTAG, TDS, AMGL, AMST, AM/LPM Ventures, SGI, Pinehurst, AM Precious Metals Singapore PTE Ltd., SMI, JMB, Goldline, SGB, AMS, AM LPM Singapore PTE Ltd., Monex, and CFC. Intercompany accounts and transactions are eliminated.
Comprehensive Income
Our other comprehensive income and losses are comprised of unrealized gains and losses associated with the translation of foreign-based equity method investments which are shown in our consolidated statements of stockholders' equity.
Use of Estimates
The preparation of consolidated financial statements in conformity with U.S. GAAP requires management to make estimates and assumptions that affect the reported amounts of assets and liabilities and disclosures of contingent assets and liabilities at the date of the consolidated financial statements, and the reported amounts of revenue and expenses during the reporting periods. These estimates include, among others, determination of fair value (primarily, with respect to precious metal inventory, derivatives, assets and liabilities acquired in business combinations, certain financial instruments, and certain investments); impairment assessments of property, plant and equipment, long-term investments, intangible assets, and goodwill; valuation allowance determination on deferred tax assets; determining the incremental borrowing rate for calculating right of use assets and lease liabilities; and revenue recognition judgments. Actual results could materially differ from these estimates.
83
Fair Value Measurement
ASC Topic 820, Fair Value Measurements and Disclosures ("ASC 820") creates a single definition of fair value for financial reporting. The rules associated with ASC 820 state that valuation techniques consistent with the market approach, income approach, and/or cost approach should be used to estimate fair value. Selection of a valuation technique, or multiple valuation techniques, depends on the nature of the asset or liability being valued, as well as the availability of data. (See Note 3.)
Concentration of Credit Risk
Cash is maintained at financial institutions, and, at times, balances exceed federally insured limits. The Company has not experienced any losses related to these balances.
Assets that potentially subject the Company to concentrations of credit risk consist principally of receivables, loans of inventory to customers, and inventory hedging transactions. Based on an assessment of credit risk, the Company typically grants collateralized credit to its customers. Credit risk with respect to loans of inventory to customers is minimal. The Company enters into inventory hedging transactions, principally utilizing metals commodity futures contracts traded on national futures exchanges or forward contracts with credit worthy financial institutions. All of our commodity derivative contracts are under master netting arrangements and include both asset and liability positions. Substantially all of these transactions are secured by the underlying metals positions.
Foreign Currency
The functional currency of the Company is the United States dollar ("USD"). All transactions in foreign currencies are recorded in USD at the then-current exchange rate(s). Upon settlement of the underlying transaction, all amounts are remeasured to USD at the current exchange rate on date of settlement. All unsettled foreign currency transactions that remain in accounts receivable and trade account payables are remeasured to USD at the period end exchange rates. Foreign currency remeasurement gains and losses are recorded in the current period earnings.
The Company has foreign subsidiaries that generate foreign currency remeasurement gains and losses. Because these entities have a functional currency of USD, foreign currency remeasurement gains and losses from these foreign subsidiaries are recorded in the current period earnings.
For the Company’s foreign-based equity method investments, the proportionate share of the investee’s income or loss is translated into USD at the average exchange rate for the period and the investment is translated using the exchange rate as of the end of the reporting period. The unrealized gains and losses associated with the translation of the investment are deferred in accumulated other comprehensive income on the Company's consolidated balance sheets.
To manage the effect of foreign currency exchange fluctuations, the Company utilizes foreign currency forward contracts. These derivatives generate gains and losses when settled and/or marked-to-market.
Business Combinations
The Company accounts for business combinations by applying the acquisition method in accordance with Business Combinations Topic 805 of the ASC (“ASC 805”). The Company evaluates each purchase transaction to determine whether the acquired assets meet the definition of a business. Transaction costs related to the acquisition of a business are expensed as incurred and excluded from the fair value of consideration transferred. The identifiable assets acquired, liabilities assumed and noncontrolling interests, if any, in an acquired entity are recognized and measured at their estimated fair values. The excess of the fair value of consideration transferred over the fair values of identifiable assets acquired, liabilities assumed and noncontrolling interests, if any, in an acquired entity is recorded as goodwill. Such valuations require management to make significant estimates and assumptions, especially with respect to intangible assets and liabilities. Net cash paid to acquire a business is classified as investing activities on the accompanying consolidated statements of cash flows.
In circumstances where an acquisition involves a contingent consideration arrangement that meets the definition of a liability under ASC Topic 480, Distinguishing Liabilities from Equity, we recognize a liability equal to the fair value of the expected contingent payments as of the acquisition date. We remeasure this liability each reporting period, with the resulting changes recorded in earnings. The assumptions used in estimating fair value of contingent consideration liabilities require significant judgment; the use of different assumptions and judgments could result in a materially different estimate of fair value which may have a material impact on our results from operations and financial position.
84
Variable Interest Entity
A variable interest entity ("VIE") is a legal entity that has either (i) a total equity investment that is insufficient to finance its activities without additional subordinated financial support or (ii) whose equity investors as a group lack the ability to control the entity’s activities or lack the ability to receive expected benefits or absorb obligations in a manner that is consistent with their investment in the entity.
A VIE is consolidated for accounting purposes by its primary beneficiary, which is the party that has both the power to direct the activities that most significantly impact the VIE's economic performance, and the obligation to absorb losses or the right to receive benefits of the VIE that could potentially be significant to the VIE. The Company consolidates VIEs when it is deemed to be the primary beneficiary. Management regularly reviews and re-evaluates its previous determinations regarding whether it holds a variable interest in potential VIEs, the status of an entity as a VIE, and whether the Company is required to consolidate such VIEs in its consolidated financial statements.
Cash and Cash Equivalents
The Company considers all highly liquid investments with original maturities of three months or less, when purchased, to be cash equivalents. The Company did not have any cash equivalents as of June 30, 2026 and June 30, 2025.
Allowance for Credit Losses
ASC 326 prescribes a credit reserving methodology known as the Current Expected Credit Loss ("CECL") model which applies to financial assets measured at amortized cost, including accounts receivable, contract assets and held-to-maturity loan receivables. Under the CECL model, we identify allowances for credit losses based on future expected losses when accounts receivable, contract assets or held-to-maturity loan receivables are created rather than when losses are probable.
The Company sets credit and position risk limits based on management's judgments of the customer's creditworthiness and regularly monitors its credit arrangements. These limits include gross position limits for counterparties engaged in sales and purchase transactions with the Company. They also include collateral limits for different types of sale and purchase transactions that counterparties may engage in from time to time.
ASC 326 provides a practical expedient for assets secured by collateral when repayment is expected to be provided substantially through the sale of the collateral in the event of the borrower's financial difficulty. In these arrangements, a reporting entity may estimate the expected credit losses by comparing the fair value of the collateral as of the balance sheet date to the asset’s amortized cost basis. In situations when the fair value of the collateral is equal to or greater than the amortized cost, a reporting entity may determine that there are no expected credit losses. The Company applies the practical expedient based on collateral maintenance provisions in estimating an allowance for credit losses for its secured loan receivables activity. The Company has not historically experienced credit losses related to its lending activity, and since it does not expect any future losses, no allowance has been recorded for this asset class. We expect trends and business practices to continue in a manner consistent with historical activity.
The Company has not historically experienced credit losses related to its other receivables activity; including (i) customer trade receivables, (ii) wholesale trade advances, and (iii) due from brokers, and, accordingly, no allowance has been recorded for these asset classes.
Stablecoin
The Company purchased stablecoin tokens from Tether, a related party, called XAU₮ in April 2026. XAU₮ tokens are digital assets issued by Tether Gold and represent a contractual right to an undivided specific interest in physical gold. The Company accounts for XAU₮ tokens as hybrid financial instruments under Derivatives and Hedging Topic 815 of the ASC ("ASC 815"). These instruments are bifurcated into two components:
85
As of June 30, 2026, the value of the Company's XAU₮ recorded within prepaid and other current assets was $
Inventories
The Company's inventory, which consists primarily of bullion and bullion coins, is acquired and initially recorded at cost and then marked to fair market value. The fair market value of the bullion and bullion coins comprises two components: (i) published market values attributable to the cost of the raw precious metal, and (ii) the market value of the premium, which is attributable to the incremental value of the product in its finished goods form. The market value attributable solely to such premium is readily determinable by reference to multiple sources.
The Company’s inventory, except for certain lower of cost or net realizable value basis products (as discussed below), are subsequently recorded at their fair market values, that is, "marked-to-market." The daily changes in the fair market value of our inventory are offset by daily changes in the fair market value of hedging derivatives that are taken with respect to our inventory positions; both the change in the fair market value of the inventory and the change in the fair market value of these derivative instruments are recorded in cost of sales in the consolidated statements of income.
While the premium component of our bullion coins included in inventory is marked-to-market, our collectible coin inventory, including its premium component, is held at the lower of cost or net realizable value, because the value of collectible coins is influenced more by supply and demand determinants than by the underlying spot price of the precious metal content of the collectible coins. Cost is determined using various methods, including the first-in, first-out (FIFO) method and the specific identification method, depending on the nature of the inventory. Unlike our bullion coins, the value of collectible coins is not subject to the same level of volatility as bullion coins because our collectible coins typically carry a substantially higher premium over the spot metal price than bullion coins. Neither the collectible coin inventory nor the premium component of our inventory is hedged. (See Note 6.)
Leased Right of Use Assets
We lease warehouse space, office facilities, and equipment. Our operating leases with terms longer than twelve months are recorded at the sum of the present value of the lease's fixed minimum payments as operating lease right of use assets ("ROU assets") in the Company’s consolidated balance sheets. Lease terms include all periods covered by renewal and termination options where the Company is reasonably certain to exercise the renewal options or not to exercise the termination options. Our lease agreements do not contain any significant residual value guarantees or material restrictive covenants. Our finance leases are another type of ROU asset, but are classified in the Company’s consolidated balance sheets as a component of property, plant, and equipment at the present value of the lease payments. Finance leases were not material during any period presented.
The ROU asset amounts include any initial direct costs incurred and lease payments made at or before the commencement date and are reduced by lease incentives. We use our incremental borrowing rate as the discount rate to determine the present value of the lease payments for leases, as our leases do not have readily determinable implicit discount rates. Our incremental borrowing rate is the rate of interest that we would incur to borrow on a collateralized basis over a similar term and amount in a similar economic environment.
The Company has made an accounting policy election not to separate lease and non-lease components for its real estate leases and to exclude short-term leases with a term of twelve months or less from its ROU assets and lease liabilities. Certain of the Company's real estate leases require payments in addition to fixed minimum lease payments. These variable lease payments primarily consist of common area maintenance charges, real estate taxes, insurance, and other operating costs that are based on actual costs incurred by the lessor. Variable lease payments are not included in the measurement of lease liabilities and are recognized in lease expense in the period incurred.
Operating lease cost is recognized on a straight-line basis over the lease term. The depreciable life of ROU assets is limited by the expected lease term, unless there is a transfer of title or purchase option reasonably certain of exercise. (See Note 7.)
For a lease modification, an evaluation is performed to determine if it should be treated as either a separate lease or a change in the accounting of an existing lease. Any amounts related to a modified lease are reflected as an operating lease ROU asset or related operating lease liability in our consolidated balance sheet.
86
Property, Plant, and Equipment
Property, plant, and equipment is stated at cost less accumulated depreciation and amortization. Depreciation and amortization are calculated using a straight-line method based on the estimated useful lives of the related assets, ranging from
Internal-use software development costs are capitalized during the application development stage. Internal-use software costs incurred during the preliminary project stage are expensed as incurred. Capitalization ceases once the software is ready for its intended use and placed into service.
Assets associated with failed sale-leaseback transactions are accounted for as property, plant, and equipment in accordance with ASC Topic 842 – Leases. These assets remain on the balance sheet and continue to be depreciated over their useful lives, as the criteria for sale accounting were not met.
The Company reviews the carrying value of these assets for impairment whenever events and circumstances indicate that the carrying value of the asset may not be recoverable. In evaluating for impairment, the carrying value of each asset or group of assets is compared to the undiscounted estimated future cash flows expected to result from its use and eventual disposition. An impairment loss is recognized for the difference when the carrying value exceeds the discounted estimated future cash flows. The factors considered by the Company in performing this assessment include current and projected operating results, trends and prospects, the manner in which these assets are used, and the effects of obsolescence, demand and competition, as well as other economic factors.
Finite-lived Intangible Assets
Finite-lived intangible assets consist primarily of customer relationships, developed technology, proprietary knowhow, and non-compete agreements. Certain existing customer relationships intangible assets are amortized in a non-linear manner which best reflects our estimate of the pattern in which the economic benefits of the assets are consumed. All other intangible assets subject to amortization are amortized using the straight-line method over their useful lives, which are estimated to be
Goodwill and Indefinite-lived Intangible Assets
Goodwill is recorded when the purchase price paid for an acquisition exceeds the estimated fair value of the net identified tangible and intangible assets acquired. Goodwill and other indefinite-lived intangibles (such as trade names, trademarks, and domain names) are not subject to amortization, but are evaluated for impairment at least annually. For tax purposes, goodwill acquired in connection with a taxable asset acquisition is generally deductible.
The Company evaluates its goodwill and other indefinite-lived intangibles for impairment in the fourth quarter of the fiscal year (or more frequently if indicators of potential impairment exist) in accordance with ASC 350. Goodwill is reviewed for impairment at a reporting unit level, which for the Company, corresponds to the Company’s operating segments.
Evaluation of goodwill for impairment
The Company has the option to first qualitatively assess whether relevant events and circumstances make it more likely than not that the fair value of the reporting unit's goodwill is less than its carrying value. A qualitative assessment includes analyzing current economic indicators associated with a particular reporting unit such as changes in economic, market and industry conditions, business strategy, cost factors, and financial performance, among others, to determine if there would be a significant decline to the fair value of a particular reporting unit. If the qualitative assessment indicates it is not more likely than not that goodwill is impaired, no further testing is required.
If, based on this qualitative assessment, management concludes that goodwill is more likely than not to be impaired, or elects not to perform the qualitative assessment, then it is required to perform a quantitative analysis to determine the fair value of the business, and compare the calculated fair value of the reporting unit with its carrying amount, including goodwill. If through this quantitative analysis the Company determines the fair value of a reporting unit exceeds its carrying amount, the goodwill of the reporting unit is considered not to be impaired. If the Company concludes that the fair value of the reporting unit is less than its carrying value, a goodwill impairment loss will be recognized for the amount by which the carrying amount exceeds the reporting unit’s fair value. (See Note 9.)
87
Evaluation of indefinite-lived intangible assets for impairment
The Company evaluates its indefinite-lived intangible assets (i.e., trade names, trademarks, and domain names) for impairment. In assessing its indefinite-lived intangible assets for impairment, the Company has the option to first perform a qualitative assessment to determine whether events or circumstances exist that lead to a determination that it is unlikely that the fair value of the indefinite-lived intangible asset is less than its carrying amount. If the Company determines that it is unlikely that the fair value of an indefinite-lived intangible asset is less than its carrying amount, the Company is not required to perform any additional tests in assessing the asset for impairment. However, if the Company concludes otherwise or elects not to perform the qualitative assessment, then it is required to perform a quantitative analysis to determine if the fair value of an indefinite-lived intangible asset is less than its carrying value. If through this quantitative analysis the Company determines the fair value of an indefinite-lived intangible asset exceeds its carrying amount, the indefinite-lived intangible asset is considered not to be impaired. If the Company concludes that the fair value of an indefinite-lived intangible asset is less than its carrying value, an impairment loss will be recognized for the amount by which the carrying amount exceeds the indefinite-lived intangible asset’s fair value.
The methods used to estimate the fair value measurements of the Company’s reporting units and indefinite-lived intangible assets include those based on the income approach (including the discounted cash flow and relief-from-royalty methods) and those based on the market approach (primarily the guideline transaction and guideline public company methods). (See Note 9.)
The Company considered the decline in its stock price and market capitalization during its fiscal third quarter of 2025 as a triggering event for interim impairment testing of the related goodwill and indefinite-lived intangible assets, and other long lived assets for its material reporting units in the prior fiscal year. The Company performed a quantitative assessment for certain material reporting units as of March 31, 2025. For these indefinite-lived intangible assets and reporting units, the Company compared their fair value to the carrying value. The fair values of indefinite-lived intangibles were estimated using the relief-from-royalty method under the income approach. The fair value of these reporting units was determined using a discounted cash flow ("DCF") model. The Company also used a market-based approach, which considered economic and comparable company metrics, to corroborate the fair value results. As a result of the quantitative assessment, the Company concluded that the fair value of these indefinite-lived intangibles and reporting units exceeded their carrying value and therefore,
Long-Term Investments
Investments in privately-held entities are accounted for using the equity method when the Company has significant influence, but not control, over the investee. Significant influence is generally deemed to exist if the Company’s ownership interest in the voting stock of the investee ranges between
Investments in privately-held entities for which the Company has little or no influence over the investee are initially recorded at cost. Because the investments do not have a readily determinable fair value, the Company has elected to measure the investments at cost minus impairments, if any, with changes recognized in earnings. If the Company identifies observable price changes in orderly transactions for an identical or a similar investment, the Company’s investment will be measured at fair value as of the date the observable transaction occurs.
We evaluate our long-term investments for impairment annually or whenever events or changes in circumstances indicate that a decline in the fair value of these assets is determined to be other-than-temporary. Additionally, the Company performs an ongoing evaluation of the investments with which the Company has variable interests to determine if any of these entities are VIEs that are required to be consolidated. None of the Company’s long-term investments were VIEs as of June 30, 2026 and June 30, 2025.
88
Accumulated Other Comprehensive Income
For the Company’s foreign-based equity method investments, the proportionate share of the investee’s income or loss is translated into U.S. dollars at the average exchange rate for the period and the investment is translated using the exchange rate as of the end of the reporting period. Foreign currency translation gains and losses associated with this activity are deferred and included as a component of accumulated other comprehensive income in the accompanying consolidated balance sheets.
Treasury Stock
The Company periodically purchases its own common stock that is traded on public markets as part of announced stock repurchase programs. The repurchased common stock is classified as treasury stock on the consolidated balance sheets and held at cost. The direct costs incurred to acquire treasury stock are treated like stock issue costs and added to the cost of the treasury stock, which includes applicable fees and taxes. We reissued treasury stock for the share consideration to acquire LPM in February 2024; we subsequently repurchased these shares in November 2024. We also reissued treasury stock for a portion of the share consideration to acquire SGI in February 2025.
Noncontrolling Interests
The Company’s consolidated financial statements include entities in which the Company has a controlling financial interest. Noncontrolling interest is the portion of equity (net assets) in an entity in which the Company has a controlling financial interest that is not attributable, directly or indirectly, to the Company. Such noncontrolling interest is reported on the consolidated balance sheets within equity, separately from the Company’s equity. On the consolidated statements of income, revenues, expenses and net income or loss from the less-than-wholly owned subsidiary are reported at their consolidated amounts, including both the amounts attributable to the Company and the noncontrolling interest. Income or loss is allocated to the noncontrolling interest based on its weighted-average ownership percentage for the applicable period. The consolidated statements of equity include beginning balances, activity for the period and ending balances for each component of stockholders’ equity, noncontrolling interest and total equity.
The table below presents the reconciliation of changes in noncontrolling interests (in thousands):
|
|
|
|
|
|
|
Balance as of June 30, 2023 |
|
|
$ |
|
|
|
Net income attributable to noncontrolling interests |
|
|
|
|
|
|
Noncontrolling ownership interest contribution - AM/LPM Ventures, LLC |
|
|
|
|
(1) |
|
Noncontrolling ownership interests - SGB |
|
|
|
|
(2) |
|
Change in ownership of consolidated subsidiary |
|
|
|
( |
) |
|
Balance as of June 30, 2024 |
|
|
|
|
|
|
Net income attributable to noncontrolling interests |
|
|
|
( |
) |
|
Noncontrolling ownership interests - SGI |
|
|
|
|
(3) |
|
Balance as of June 30, 2025 |
|
|
|
|
|
|
Net income attributable to noncontrolling interests |
|
|
|
|
|
|
Noncontrolling ownership interests - SMI |
|
|
|
|
(4) |
|
Balance as of June 30, 2026 |
|
|
$ |
|
|
|
_________________________________________________________
(1) |
In February 2024, Aquila Holding LLC purchased a |
(2) (3) |
In June 2024, the Company obtained a controlling interest in SGB. In February 2025, in connection with its acquisition of SGI, the Company acquired certain noncontrolling interests. |
(4) |
In April 2026, in connection with its acquisition of SMI, the Company acquired a noncontrolling interest in SMI's joint venture in Shanghai. |
Revenue Recognition
Settlement Date Accounting
The majority of the Company’s sales of precious metals are conducted using sales contracts that meet the definition of derivative instruments in accordance with ASC 815. The contract underlying the Company's commitment to deliver precious metals is referred to as a “fixed-price forward commodity contract” because the price of the commodity is fixed at the time the order is placed. Revenue is recognized on the settlement date, which is defined as the date on which: (i) the quantity, price, and specific items being purchased have been established, (ii) metals have been delivered to the customer, and (iii) payment has been received or is covered by the customer’s established credit limit with the Company.
89
The Company also sells precious metals held in third-party storage for the benefit of the customer. The customer may request physical delivery at any time. Although the complete economic interest transfers to the customer at the time of sale, followed by the transfer of legal title, revenue is not recognized until physical delivery occurs. Prior to delivery, the Company records gains or losses within cost of sales based on fluctuations in the precious metals value relative to the fixed prices paid by the customer. These metals are classified as restricted inventory, with a corresponding liability on borrowed metals representing the obligation to deliver the metals in the future.
All derivative instruments are marked-to-market during the interval between the order date and the settlement date, with the changes in the fair value charged to cost of sales. The Company’s hedging strategy to mitigate the market risk associated with its sales commitments is described separately below under the caption “Hedging Activities.”
Types of Orders that are Physically Delivered
The Company’s contracts to sell precious metals to customers are usually settled with the physical delivery of metals to the customer, although net settlement (i.e., settlement at an amount equal to the difference between the contract value and the market price of the metal on the settlement date) is permitted. Below is a summary of the Company’s major order types and the key factors that determine when settlement occurs and when revenue is recognized for each type:
In general, unshipped orders for which a customer advance has been received by the Company are classified as advances from customers. Orders that have been paid for and shipped, but not yet delivered to the customer are classified as deferred revenue. Both customer advances and deferred revenue are shown, in the aggregate, as deferred revenue and other advances in the consolidated financial statements. (See Note 11.)
Hedging Activities
The value of our inventory and our purchase and sale commitments are linked to the prevailing price of the underlying precious metal commodity. The Company seeks to minimize the effect of price changes of the underlying commodity and enters into inventory hedging transactions, principally utilizing metals commodity forward contracts with credit worthy financial institutions or futures contracts traded on national futures exchanges. The Company hedges by each commodity type (gold, silver, platinum, and palladium). All of our commodity derivative contracts are under master netting arrangements and include both asset and liability positions.
Commodity forward and futures contracts entered into for hedging purposes are recorded at fair value on the trade date and are marked-to-market each period. The difference between the original contract values and the market values of these contracts are reflected as derivative assets or derivative liabilities in the consolidated balance sheets at fair value, with the corresponding unrealized gains or losses included as a component of cost of sales. When these contracts are net settled, the unrealized gains and losses are reversed and the realized gains and losses for forward contracts are recorded in revenue and cost of sales, respectively, and the net realized gains and losses for futures are recorded in cost of sales.
90
The Company enters into forward and futures contracts solely for the purpose of hedging our inventory holding risk, and not for speculative market purposes. The Company’s gains and losses on derivative instruments are substantially offset by the changes in the fair market value of the underlying precious metals inventory, which is also recorded in cost of sales in the consolidated statements of income. (See Note 12.)
Revenue from Contracts with Customers
The Company recognizes its sale of collectible coins, storage, logistics, licensing, specialized auction, minting and refining, and other services revenues in accordance with ASC 606, Revenue from Contracts with Customers. In aggregate, these types of revenues account for less than
The Company’s revenue from contracts with customers under ASC 606 primarily consists of sales of numismatic products. Set forth below are the Company's two main methods of delivering numismatic product to customers which dictate how and when revenue is recognized:
E-commerce, wholesale, physical retail and phone sales (Pinehurst, SGI and AMS). Under these arrangements, the contract is normally established once the order is placed by the customer, which can be through email, e-commerce order or verbally with a sales representative. Within each contract, each item ordered represents a distinct performance obligation, and revenue is recognized when control transfers to the customer, which is upon delivery of each item. The title to the product transfers to the customer at the time of delivery. There is no variable consideration relating to this type of revenue. The Company acts as the principal in these transactions.
Collectability is deemed probable as for a majority of the sales, the product is shipped after complete payment has been received. However, there are instances where prolonged credit terms to certain credit-worthy customers are offered which allow customers to split their payments over a set number of installments. The Company determined that the collectability is still probable as these terms are offered only to qualified customers. Normally, there is no difference between the amount the customer pays when they select the option to split their payments or if they have paid in full as there is no interest or financing fees charged. The Company elected to use a practical expedient and not adjust the amount of consideration for the effects of a financing component as the Company expects these to be collected within the 12 month period.
The Company offers returns to its customers under a stated return policy where the customer can return the product within an allotted timeline and receive a refund. Revenue is recorded, net of a provision for anticipated returns, which is recorded at each reporting period based on historical experience and current expectations.
Costs to obtain the contract with the customer, such as sales commissions paid to internal sales representatives and related wages, are expensed as incurred as they are not expected to be recovered.
Sales taxes, value added taxes and other taxes that are collected in connection with revenue transactions are withheld and remitted to the respective taxing authorities and are excluded from revenue. The Company elected to account for shipping and handling as activities to fulfill the promise to transfer the goods. Therefore, shipping and handling fees that are billed to the customer are recognized in revenue and the associated shipping and handling costs are recognized in cost of sales when control of the goods transfers to the customer.
Auctions (SGI). For a single auction transaction, there are typically two contracts established with two separate customers resulting in two different revenue streams (sellers commission and buyer’s premium) earned from two different parties – the seller (or consignor) and the buyer. As the Company does not control the underlying inventory and its responsibility is to facilitate a buy-and-sell transaction, the Company is acting as an agent in auction transactions, and revenue is recorded on a net basis.
The Company’s performance obligation to the seller is to sell the consigned product through the auction platform. As part of auctioning the consigned item, the Company provides services (marketing, cataloging and others) that are treated as a single performance obligation since they are not distinct and are highly dependent and interrelated within the context of the auction contract. The costs for these services are capitalized and expensed once the auction is completed. Contract assets were not material for any period presented. The Company holds the consigned item as an agent for consignor until title of the consigned item passes directly from the consignor to the buyer. The transaction price is determined based on the hammer price and as a percentage of the winning bid as outlined in the consignor contract. There is no variable consideration relating to the seller’s commission. As the Company is paid by the buyer before the seller can be paid, collection is deemed probable. Once the product is delivered to the buyer, the performance obligation is satisfied and revenue and related expenses are recognized.
91
The Company’s performance obligation to the buyer is to deliver the consigned product to the bidder that won the product at an auction. At the end of an auction, the Company invoices the winning bidder and upon receipt of payment, the Company packages and delivers the items to the winning bidder. The transaction price is determined by the published buyer’s premium amount (typically
The Company does not offer returns relating to auction sales. Costs involved with fulfilling the contracts in auctions (cataloging, appraising, preparation and performance of an auction, and delivery of goods to winning bidders) are recorded as prepaid assets and expensed at the conclusion of the related auctions.
Contract Liabilities
Interest Income
In accordance with Interest Topic 835 of the ASC ("ASC 835"), the following are interest income generating activities of the Company:
Interest Expense
The Company accounts for interest expense on the following arrangements in accordance with ASC 835:
92
Leased metal transactions are a similar type of transaction, except the Company is not required to pledge other precious metal as collateral for the precious metal received. The fees charged by the third-party are based on the spot value of the pool metal received.
Both borrowed and leased metal transactions provide a source of liquidity, as the Company usually monetizes the metals received under such arrangements. Repayment is usually in the same form as the metals advanced, but may be settled in cash.
Amortization of Debt Issuance Costs
Debt issuance costs incurred in connection with the Trading Credit Facility are included in prepaid expenses and other assets in the Company's consolidated balance sheets. Debt issuance costs are amortized to interest expense over the contractual term of the debt. Debt issuance costs of the Trading Credit Facility are amortized on a straight-line basis, while all other debt issuance costs are amortized using the effective interest method. Amortization of debt issuance costs included in interest expense was $
Earnings from Equity Method Investments
The Company's proportional interest in the reported earnings or losses from equity method investments is shown on the consolidated statements of income as earnings (losses) from equity method investments.
Other Income and Expense, Net
The Company's other income or expense, net is comprised of royalty and consulting income, which is recognized when earned, gains or losses on other investments, and fair value adjustments to our acquisition-related contingent consideration liabilities.
Advertising
Advertising and marketing costs consist primarily of internet advertising, online marketing, direct mail, print media, and television commercials and are expensed when incurred. Advertising costs totaled $
Shipping and Handling Costs
Shipping and handling costs represent costs associated with shipping product to customers and receiving product from vendors and are included in cost of sales in the consolidated statements of income. Shipping and handling costs totaled $
93
Share-Based Compensation
Equity-based awards
The Company accounts for equity awards under the provisions of Compensation - Stock Compensation Topic 718 of the ASC ("ASC 718"), which establishes fair value-based accounting requirements for share-based compensation to employees. ASC 718 requires the Company to recognize the grant-date fair value of stock options and other equity-based compensation issued to employees as expense over the service period in the Company's consolidated financial statements. The expense is adjusted (excluding awards settleable in cash) for actual forfeitures of unvested awards as they occur. For equity awards that contain a performance condition other than market condition, when the outcome of the performance condition is determined to be not probable, no compensation expense is recognized, and any previously recognized compensation expense is reversed. (See Note 17.)
Liability-based awards
The Company has granted a cash-incentive award based on the total shareholder return of the Company's common stock determined at the end of the award's performance period. Because the award will be settled in cash, the Company accounts for it as a liability-based award and, as such, expense relating to this award is required to be measured at fair value at each reporting date until the date of settlement. (See Note 17.)
Income Taxes
As part of the process of preparing its consolidated financial statements, the Company is required to estimate its provision for income taxes in each of the tax jurisdictions in which it conducts business, in accordance with Income Taxes Topic 740 of the ASC ("ASC 740"). The Company computes its annual tax rate based on the statutory tax rates and tax planning opportunities available to it in the various jurisdictions in which it earns income. Significant judgment is required in determining the Company's annual tax rate and in evaluating uncertainty in its tax positions. The Company has adopted the provisions of ASC 740-10, which clarifies the accounting for uncertain tax positions. ASC 740-10 requires that the Company recognizes the impact of a tax position in the financial statements if the position is not more likely than not to be sustained upon examination based on the technical merits of the position. The Company recognizes interest and penalties related to certain uncertain tax positions as a component of income tax expense and the accrued interest and penalties are included in deferred and income taxes payable in the Company’s consolidated balance sheets. See Note 13 for more information on the Company’s accounting for income taxes.
Income taxes are accounted for using an asset and liability approach that requires the recognition of deferred tax assets and liabilities for the expected future tax consequences of events that have been included in the financial statements. Under this method, deferred tax assets and liabilities are determined based on the differences between the financial statement and tax basis of assets and liabilities using enacted tax rates in effect for the year in which the differences are expected to reverse. The effect of a change in tax rates on deferred tax assets and liabilities is recognized in income in the period that includes the enactment date. A valuation allowance is provided when it is more likely than not that some portion or all of the net deferred tax assets will not be realized. The factors used to assess the likelihood of realization include the Company's forecast of the reversal of temporary differences, future taxable income, and available tax planning strategies that could be implemented to realize the net deferred tax assets. Failure to achieve forecasted taxable income in applicable tax jurisdictions could affect the ultimate realization of deferred tax assets and could result in an increase in the Company's effective tax rate on future earnings. Based on our assessment, it appears more likely than not that all of the net deferred tax assets will be realized through future taxable income.
Earnings per Share ("EPS")
The Company calculates basic EPS by dividing net income or loss by the weighted-average number of common shares outstanding during the year. Diluted EPS is calculated by dividing net income or loss by the weighted-average number of common shares outstanding during the year, adjusted for the potentially dilutive effect of stock options, restricted stock units (“RSUs"), and deferred stock units (“DSUs"), using the treasury stock method.
The Company considers participating securities in its calculation of EPS. Under the two-class method of calculating EPS, earnings are allocated to both common shares and participating securities. The Company’s participating securities include vested RSU and DSU awards. Unvested RSU and DSU awards are not considered participating securities as they are forfeitable until the vesting date. The allocation of earnings to participating securities under the two-class method was not significant for any period presented.
A reconciliation of shares used in calculating basic and diluted earnings per common share is presented below (in thousands):
|
|
Year Ended June 30, |
|
|||||||||
|
|
2026 |
|
|
2025 |
|
|
2024 |
|
|||
Basic weighted-average shares of common stock outstanding |
|
|
|
|
|
|
|
|
|
|||
Effect of common stock equivalents |
|
|
|
|
|
|
|
|
|
|||
Diluted weighted-average shares outstanding |
|
|
|
|
|
|
|
|
|
|||
94
The anti-dilutive shares excluded from the table above were
Recent Accounting Pronouncements
From time to time, the Financial Accounting Standards Board ("FASB") or other standards setting bodies issue new accounting pronouncements. Updates to the FASB ASC are communicated through issuance of an Accounting Standards Update ("ASU").
Recently Adopted Accounting Standards
In December 2023, the FASB issued , Income Taxes (Topic 740): Improvements to Income Tax Disclosures ("ASU 2023-09"), which updated the guidance on income tax disclosures to require entities to disclose specific categories within the rate reconciliation, provide additional information for reconciling items that meet certain quantitative thresholds, and provide additional information about income taxes paid. We adopted this guidance prospectively in this Form 10-K. The
Recently Issued Accounting Standards not yet adopted
In November 2024, the FASB issued ASU No. 2024-03, Disaggregation of Income Statement Expenses (Topic 220), which requires additional disclosures, for interim and annual reporting, of expenses by nature, such as inventory purchases, employee compensation, depreciation and amortization, and selling expenses. This update is effective for the Company for its fiscal year beginning July 1, 2027 and interim periods thereafter, and may be applied either prospectively or retrospectively. We are currently evaluating the impact of the adoption of this standard on our consolidated financial statements.
In September 2025, the FASB issued ASU No. 2025-06, Targeted Improvements to the Accounting for Internal-Use Software, which simplifies the guidance by removing all references to software development project stages so that the guidance is neutral to different software development methods. This ASU will be effective for the Company for the first fiscal quarter of 2029, and may be adopted either prospectively, retrospectively, or through modified retrospective application. Early adoption is permitted. We are currently evaluating the impact of the adoption of this standard on our consolidated financial statements.
In November 2025, the FASB issued ASU 2025-09, Derivatives and Hedging (Topic 815): Hedge Accounting Improvements, which includes amendments to more closely align hedge accounting with the economics of an entity’s risk management activities. This update is effective for the Company for its fiscal year beginning July 1, 2027 and interim periods thereafter, and should be applied prospectively. We are currently evaluating the impact of the adoption of this standard on our consolidated financial statements.
Management does not believe that any other recently issued, but not yet effective for the Company, accounting pronouncement, if currently adopted would have a material effect on the Company's consolidated financial statements.
3. ASSETS AND LIABILITIES, AT FAIR VALUE
Fair Value of Financial Instruments
A financial instrument is defined as cash, evidence of an ownership interest in an entity, or a contract that creates a contractual obligation or right to deliver or receive cash or another financial instrument from a second entity. The fair value of financial instruments represents amounts that would be received upon the sale of those assets or that would be paid to transfer those liabilities in an orderly transaction between market participants at that date. Those fair value measurements maximize the use of observable inputs. However, in situations where there is little, if any, market activity for the asset or liability at the measurement date, the fair value measurement reflects the Company’s own judgments about the assumptions that market participants would use in pricing the asset or liability. Those judgments are developed by the Company based on the best information available in the circumstances, including expected cash flows and appropriately risk adjusted discount rates, and available observable and unobservable inputs.
For most of the Company's financial instruments, the carrying amount approximates fair value. The carrying amounts of cash, receivables, secured loans receivable, accounts payable and other current liabilities, accrued liabilities, and income taxes payable approximate fair value due to their short-term nature. The carrying amounts of derivative assets and derivative liabilities, liabilities on borrowed metals and product financing arrangements are marked-to-market on a daily basis to fair value. The carrying amounts of lines of credit approximate fair value based on the borrowing rates currently available to the Company for bank loans with similar terms and average maturities.
95
Valuation Hierarchy
In determining the fair value of its financial instruments, the Company employs a fair value hierarchy that prioritizes the inputs for the valuation techniques used to measure fair value. ASC 820 established a three-level valuation hierarchy for disclosure of fair value measurements. The valuation hierarchy is based upon the transparency of inputs to the valuation of an asset or liability as of the measurement date. The three levels are defined as follows:
Assets and Liabilities Measured at Fair Value on a Recurring Basis
The significant assumptions used to determine the carrying value and the related fair value of the assets and liabilities measured at fair value on a recurring basis are described below:
Inventories. The Company's inventory, which consists primarily of bullion and bullion coins, is acquired and initially recorded at cost and then marked to fair market value. The fair market value of the bullion and bullion coins comprises two components: (i) published market values attributable to the cost of the raw precious metal, and (ii) the market value of the premium, which is attributable to the incremental value of the product in its finished goods form. The market value attributable solely to such premium is readily determinable by reference to multiple sources. Except for collectible coin inventory, which are included in inventory at the lower of cost or net realizable value, the Company’s inventory is subsequently recorded at their fair market values on a daily basis. The fair value for commodities inventory (i.e., inventory excluding collectible coins) is determined using pricing data derived from the markets on which the underlying commodities are traded. Precious metals commodities inventory is classified in Level 1 of the valuation hierarchy.
Derivatives. Futures contracts, forward contracts, and open sale and purchase commitments are valued at their fair values, based on the difference between the quoted market price and the contractual price (i.e., intrinsic value) and are included within Level 1 of the valuation hierarchy.
Margin and Borrowed Metals Liabilities. Certain margin and borrowed metals liabilities consist of the Company's commodity obligations to margin customers and suppliers, respectively. We also record liabilities on borrowed metals for precious metals held in third-party storage for the benefit of the customer which are measured at fair value on a recurring basis. These margin liabilities and borrowed metals liabilities are carried at fair value, which is determined using quoted market pricing and data derived from the markets on which the underlying commodities are traded, and are classified as Level 1 of the valuation hierarchy.
Product Financing Arrangements. Product financing arrangements consist of financing agreements for the transfer and subsequent re-acquisition of gold and silver at an agreed-upon price based on the spot price with a third-party. Such transactions allow the Company to repurchase this inventory upon demand. The third-party charges monthly interest as a percentage of the market value of the outstanding obligation, which is carried at fair value. The obligation is stated at the amount required to repurchase the outstanding inventory. Fair value is determined using quoted market pricing and data derived from the markets on which the underlying commodities are traded. Product financing arrangements are classified in Level 1 of the valuation hierarchy.
Acquisition-related Contingent Consideration.
LPM
We may be required to pay contingent consideration up to $
The contingent consideration liability related to our acquisition of LPM is measured at fair value at each reporting period using a Monte Carlo Simulation model ("MCS model") with Level 3 unobservable inputs including estimated future cash flows generated by LPM, discount rates, and earnings volatility. Key assumptions used in the MCS model as of June 30, 2026 were an EBITDA risk premium of
96
Pinehurst
We may be required to pay contingent consideration up to $
The contingent consideration liability related to our acquisition of Pinehurst is measured at fair value at each reporting period primarily using an MCS model with Level 3 unobservable inputs including estimated future cash flows generated by Pinehurst, discount rates, and pre-tax earnings volatility. Key assumptions used in the MCS model as of June 30, 2026 were a pre-tax earnings risk premium of
AMS
We may be required to pay contingent consideration of up to an additional $
The contingent consideration liability related to our acquisition of AMS is measured at fair value at each reporting period primarily using an MCS model with Level 3 unobservable inputs including estimated future cash flows generated by AMS, discount rates, and EBITDA volatility. Key assumptions used in the MCS model as of June 30, 2026 were an EBITDA risk premium of
Monex
The contingent consideration liability related to our acquisition of Monex is measured at fair value at each reporting period primarily using an MCS model with Level 3 unobservable inputs including estimated future cash flows generated by Monex, discount rates, and pre-tax net income volatility. Key assumptions used in the MCS model as of June 30, 2026 were a pre-tax risk premium of
Stablecoin
The Company purchased stablecoin tokens from Tether, a related party, called XAU₮ in April 2026. XAU₮ tokens are digital assets issued by Tether Gold and represent a contractual right to an undivided specific interest in physical gold. The Company accounts for XAU₮ tokens as hybrid financial instruments under ASC 815. Fair value of XAU₮ is determined using quoted market pricing and data derived from the markets on which the underlying commodities are traded and are therefore classified in Level 1 of the valuation hierarchy.
97
The following tables present information about the Company's assets and liabilities measured at fair value on a recurring basis, aggregated by each fair value hierarchy level (in thousands):
|
|
June 30, 2026 |
|
|||||||||||||
|
|
Quoted Price in Active Markets for Identical Instruments |
|
|
Significant Other Observable Inputs |
|
|
Significant Unobservable Inputs |
|
|
Total |
|
||||
Assets: |
|
|
|
|
|
|
|
|
|
|
|
|
||||
Inventories(1) |
|
$ |
|
|
$ |
|
|
$ |
|
|
$ |
|
||||
Derivative assets — open sale and purchase commitments, net |
|
|
|
|
|
|
|
|
|
|
|
|
||||
Derivative assets — futures contracts |
|
|
|
|
|
|
|
|
|
|
|
|
||||
Derivative assets — forward contracts |
|
|
|
|
|
|
|
|
|
|
|
|
||||
Stablecoin |
|
|
|
|
|
|
|
|
|
|
|
|
||||
Total assets, valued at fair value |
|
$ |
|
|
$ |
|
|
$ |
|
|
$ |
|
||||
Liabilities: |
|
|
|
|
|
|
|
|
|
|
|
|
||||
Liabilities on borrowed metals |
|
$ |
|
|
$ |
|
|
$ |
|
|
$ |
|
||||
Product financing arrangements |
|
|
|
|
|
|
|
|
|
|
|
|
||||
Derivative liabilities — open sale and purchase commitments, net |
|
|
|
|
|
|
|
|
|
|
|
|
||||
Derivative liabilities — margin accounts |
|
|
|
|
|
|
|
|
|
|
|
|
||||
Derivative liabilities — futures contracts |
|
|
|
|
|
|
|
|
|
|
|
|
||||
Derivative liabilities — forward contracts |
|
|
|
|
|
|
|
|
|
|
|
|
||||
Acquisition-related contingent consideration |
|
|
|
|
|
|
|
|
|
|
|
|
||||
Total liabilities, valued at fair value |
|
$ |
|
|
$ |
|
|
$ |
|
|
$ |
|
||||
|
|
June 30, 2025 |
|
|||||||||||||
|
|
Quoted Price in Active Markets for Identical Instruments |
|
|
Significant Other Observable Inputs |
|
|
Significant Unobservable Inputs |
|
|
Total |
|
||||
Assets: |
|
|
|
|
|
|
|
|
|
|
|
|
||||
Inventories(1) |
|
$ |
|
|
$ |
|
|
$ |
|
|
$ |
|
||||
Derivative assets — open sale and purchase commitments, net |
|
|
|
|
|
|
|
|
|
|
|
|
||||
Derivative assets — futures contracts |
|
|
|
|
|
|
|
|
|
|
|
|
||||
Derivative assets — forward contracts |
|
|
|
|
|
|
|
|
|
|
|
|
||||
Total assets, valued at fair value |
|
$ |
|
|
$ |
|
|
$ |
|
|
$ |
|
||||
Liabilities: |
|
|
|
|
|
|
|
|
|
|
|
|
||||
Liabilities on borrowed metals |
|
$ |
|
|
$ |
|
|
$ |
|
|
$ |
|
||||
Product financing arrangements |
|
|
|
|
|
|
|
|
|
|
|
|
||||
Derivative liabilities — open sale and purchase commitments, net |
|
|
|
|
|
|
|
|
|
|
|
|
||||
Derivative liabilities — margin accounts |
|
|
|
|
|
|
|
|
|
|
|
|
||||
Derivative liabilities — futures contracts |
|
|
|
|
|
|
|
|
|
|
|
|
||||
Derivative liabilities — forward contracts |
|
|
|
|
|
|
|
|
|
|
|
|
||||
Acquisition-related contingent consideration |
|
|
|
|
|
|
|
|
|
|
|
|
||||
Stock payable liability |
|
|
|
|
|
|
|
|
|
|
|
|
||||
Total liabilities, valued at fair value |
|
$ |
|
|
$ |
|
|
$ |
|
|
$ |
|
||||
There were no transfers in or out of Level 2 or 3 from other levels within the fair value hierarchy during the reported periods.
Assets Measured at Fair Value on a Non-Recurring Basis
Certain assets are measured at fair value on a nonrecurring basis. These assets are not measured at fair value on an ongoing basis, but are subject to fair value adjustments only under certain circumstances. These include (i) investments in private companies when there are identifiable events or changes in circumstances that may have a significant adverse impact on the fair value of these assets, (ii) equity method investments that are remeasured to the acquisition-date fair value upon the Company obtaining a controlling interest in the investee during a step acquisition, (iii) property, plant, and equipment and definite-lived intangibles, (iv) goodwill, and (v) indefinite-lived intangibles, all of which are written down to fair value when they are held for sale or determined to be impaired.
98
Our non-recurring valuations use significant unobservable inputs and significant judgments and therefore fall under Level 3 of the fair value hierarchy. The valuation inputs include assumptions on the appropriate discount rates, long-term growth rates, relevant comparable company earnings multiples, and the amount and timing of expected future cash flows. The cash flows employed in the analyses are based on the Company’s estimated outlook and various growth rates. Discount rate assumptions are based on an assessment of the risk inherent in the future cash flows of the respective equity method investment, asset group, or reporting unit. In assessing the reasonableness of its determined fair values, the Company evaluates its results against other value indicators, such as comparable transactions and comparable public company trading values.
4. RECEIVABLES, NET
Receivables, net consisted of the following (in thousands):
|
|
June 30, 2026 |
|
|
June 30, 2025 |
|
||
Customer trade receivables |
|
$ |
|
|
$ |
|
||
Wholesale trade advances |
|
|
|
|
|
|
||
Due from brokers and other |
|
|
|
|
|
|
||
|
|
$ |
|
|
$ |
|
||
Customer Trade Receivables. Customer trade receivables represent short-term, non-interest bearing amounts due from precious metal sales, advances related to financing products, and other secured interests in assets of the customer.
Wholesale Trade Advances. Wholesale trade advances represent advances of various bullion products and cash advances for purchase commitments of precious metal inventory. Typically, these advances are unsecured, short-term, and non-interest bearing, and are made to wholesale metals dealers and government mints.
Due from Brokers and Other. Due from brokers and other consists of the margin requirements held at brokers related to open futures contracts (see Note 12) and other receivables.
5. SECURED LOANS RECEIVABLE
Below is a summary of the carrying value of our secured loans (in thousands):
|
|
June 30, 2026 |
|
|
June 30, 2025 |
|
||
Secured loans originated |
|
$ |
|
|
$ |
|
||
Secured loans acquired |
|
|
|
|
|
|
||
|
|
$ |
|
|
$ |
|
||
Secured Loans - Originated: Secured loans include short-term loans, which include a combination of on-demand lines and short-term facilities. These loans are fully secured by the customer's assets, which predominantly include bullion, numismatic, and semi-numismatic material, and are typically held in safekeeping by the Company.
Secured Loans - Acquired: Secured loans also include short-term loans, which include a combination of on-demand lines and short-term facilities that are purchased from our customers. The Company acquires a portfolio of their loan receivables at a price that approximates the outstanding balance of each loan in the portfolio, as determined on the effective transaction date. Each loan in the portfolio is fully secured by the borrower's assets, which could include bullion, numismatic or semi-numismatic material, and are typically held in safekeeping by the Company. The seller of the loan portfolio generally retains responsibility for the servicing and administration of the loans.
As of June 30, 2026 and June 30, 2025, our secured loans carried weighted-average effective interest rates of
Credit Quality of Secured Loans Receivables and Allowance for Credit Losses
General
The Company's secured loan receivables portfolio comprises loans with similar credit risk profiles, which enables the Company to apply a standard methodology to determine the credit quality for each loan and the allowance for credit losses, if any.
99
The credit quality of each loan is generally determined by the collateral value assessment, loan-to-value (“LTV”) ratio (that is, the principal amount of the loan divided by the estimated value of the collateral) and the type (or class) of secured material. All loans are fully secured by precious metal bullion, numismatic and semi-numismatic collateral, or graded sports cards, which remains in the physical custody of the Company for the duration of the loan. The term of the loans is generally
When an account is in default or if a margin call has not been met on a timely basis, the loan is considered non-performing and the Company has the right to liquidate the borrower's collateral in order to satisfy the unpaid balance of the outstanding loans, including accrued and unpaid interest.
Class and Credit Quality of Loans
The three classes of secured loan receivables are defined by collateral type: (i) bullion, (ii) numismatic and semi-numismatic and (iii) graded sports cards. The Company's required LTV ratios vary with the class of loans. Typically, the Company requires an LTV ratio of approximately
The Company's secured loans by portfolio class, which align with internal management reporting, were as follows (in thousands):
|
|
June 30, 2026 |
|
|
June 30, 2025 |
|
||||||||||
Bullion |
|
$ |
|
|
|
% |
|
$ |
|
|
|
% |
||||
Numismatic and semi-numismatic |
|
|
|
|
|
% |
|
|
|
|
|
% |
||||
Graded sports cards |
|
|
|
|
|
% |
|
|
|
|
|
% |
||||
|
|
$ |
|
|
|
% |
|
$ |
|
|
|
% |
||||
Due to the nature of market fluctuations of precious metal commodity prices, we monitor the bullion collateral value of each loan on a daily basis, based on the spot price of precious metals. Numismatic and graded sports cards collateral values are updated by numismatic and graded sports cards specialists typically within every
Generally, we initiate the margin call process when the outstanding loan balance is in excess of
Loans with LTV ratios of less than 75% are generally considered to be higher quality loans.
|
|
June 30, 2026 |
|
|
June 30, 2025 |
|
||||||||||
Loan-to-value of less than 75% |
|
$ |
|
|
|
% |
|
$ |
|
|
|
% |
||||
Loan-to-value of 75% or more |
|
|
|
|
|
% |
|
|
|
|
|
% |
||||
|
|
$ |
|
|
|
% |
|
$ |
|
|
|
% |
||||
The Company had
Non-Performing Loans/Impaired Loans
Allowance for secured loan credit losses attributable to non-performing loans is recorded based on the most probable source of repayment, which is normally the liquidation of collateral. Due to the accelerated liquidation terms of the Company's loan portfolio, past due loans are generally liquidated within 90 days of default. In the event a loan were to become non-performing and the collateral is not sufficient to satisfy amounts due, the Company would determine a reserve to reduce the carrying balance to its estimated net realizable value. As of June 30, 2026 and June 30, 2025, the Company had
100
A loan is considered impaired if it is probable, based on current information and events, that the Company will be unable to collect all amounts due according to the contractual terms of the loan. Historically, the Company has not established an allowance for any credit losses because the Company maintains sufficient collateral to satisfy amounts due. Customer loans are reviewed for impairment, which include loans that are non-performing, or if the customer is in bankruptcy. In the event of an impairment, recognition of interest income would be suspended, and the loan would be placed on non-accrual status at that time. Accrual would be resumed, and previously suspended interest income would be recognized, when the loan becomes contractually current and/or collection doubts are removed. Cash receipts on impaired loans are recorded first against the principal and then against any unrecognized interest income. The Company incurred
6. INVENTORIES
Our inventory consists of the precious metals that the Company has physically received, and inventory held by third-parties, which, at the Company's option, it may or may not receive.
|
|
June 30, 2026 |
|
|
June 30, 2025 |
|
||
Inventory held for sale |
|
$ |
|
|
$ |
|
||
Repurchase arrangements with customers |
|
|
|
|
|
|
||
Consignment arrangements with customers |
|
|
|
|
|
|
||
Collectible coins, held at lower of cost or net realizable value |
|
|
|
|
|
|
||
Borrowed precious metals (1) |
|
|
|
|
|
|
||
Product financing arrangements |
|
|
|
|
|
|
||
|
|
$ |
|
|
$ |
|
||
Inventory Held for Sale. Inventory held for sale represents precious metals, excluding collectible coin inventory, that have been received by the Company and are not subject to repurchase by or consignment arrangements with third parties, borrowed precious metals, or product financing arrangements.
Repurchase Arrangements with Customers. The Company enters into arrangements with certain customers under which we sell and then purchase precious metals from our customer and the customer can repurchase the product at the fair value on the repurchase date. These initial transactions with the customer do not qualify as sales and are excluded from revenue. Under these arrangements, the Company, which holds legal title to the metals, earns financing income until the time the arrangement is terminated, or the material is repurchased by the customer. In the event of a repurchase by the customer, the Company records a sale.
These arrangements are typically terminable by either party upon 14 days' notice. Upon termination, the customer’s rights to repurchase any remaining inventory is forfeited.
Consignment Arrangements with Customers. The Company periodically loans metals to customers on a short-term consignment basis. These transactions are recorded as sales and are removed from the Company's inventory at the time the customer elects to price and purchase the precious metals.
Collectible Coins. Our collectible coin inventory, including its premium component, is held at the lower of cost or net realizable value, because the value of collectible coins is influenced more by supply and demand than by the underlying spot price of the precious metal content. The value of collectible coins is not subject to the same level of volatility as bullion coins because collectible coins typically carry a substantially higher premium over the spot metal price than bullion coins. Our collectible coins are not hedged.
Borrowed Precious Metals. Borrowed precious metals inventory include: (i) metals held by suppliers as collateral on advanced pool metals, (ii) metals due to suppliers for the use of their consigned inventory, (iii) metal positions held by customers in the Company’s inventory, and (iv) shortages in unallocated metal positions held by the Company in the supplier’s inventory. Unallocated or pool metal represents an unsegregated inventory position that is due on demand, in a specified physical form, based on the total ounces of metal held in the position. Amounts due under these arrangements require delivery either in the form of precious metals or cash.
101
Product Financing Arrangements. This inventory represents amounts held as security by lenders for obligations under product financing arrangements. The Company enters into a product financing agreement for the transfer and subsequent re-acquisition of gold and silver at an agreed-upon price based on the spot price with a third-party finance company. This inventory is restricted and is held at a custodial storage facility in exchange for a financing fee, paid to the third-party finance company. During the term of the financing, the third-party finance company holds the inventory as collateral, and both parties intend for the inventory to be returned to the Company at an agreed-upon price based on the spot price on the finance arrangement repurchase date. These transactions do not qualify as sales and have been accounted for as financing arrangements in accordance with ASC 470-40 Product Financing Arrangements. The obligation is stated at the amount required to repurchase the outstanding inventory. Both the product financing arrangements and the underlying inventory are carried at fair value, with changes in fair value included in cost of sales in the consolidated statements of income.
The Company mitigates market risk of its physical inventory and open commitments through commodity hedge transactions. (See Note 12.) As of June 30, 2026 and June 30, 2025, the unrealized gains or losses resulting from the difference between market value and cost of physical inventory, excluding collectible coin inventory, were losses of $
Premium Component of Inventory
The premium component, at market value, included in the inventory as of June 30, 2026 and June 30, 2025 totaled $
7. LEASES
Components of lease expense were as follows (in thousands):
|
|
Year Ended June 30, |
|
|||||||||
|
|
2026 |
|
|
2025 |
|
|
2024 |
|
|||
Operating lease costs |
|
$ |
|
|
$ |
|
|
$ |
|
|||
Variable lease costs |
|
|
|
|
|
|
|
|
|
|||
Short term lease costs |
|
|
|
|
|
|
|
|
|
|||
Finance lease costs |
|
|
|
|
|
|
|
|
|
|||
|
|
$ |
|
|
$ |
|
|
$ |
|
|||
For the year ended June 30, 2026, we made cash payments of $
The future undiscounted cash flows for each of the next five years and thereafter, and reconciliation to the lease liabilities as of June 30, 2026 for our operating leases were as follows (in thousands):
Fiscal Year ending June 30, |
|
Operating Leases |
|
|
|
2027 |
|
$ |
|
|
|
2028 |
|
|
|
|
|
2029 |
|
|
|
|
|
2030 |
|
|
|
|
|
2031 |
|
|
|
|
|
Thereafter |
|
|
|
|
|
Total lease payments |
|
|
|
|
|
Imputed interest |
|
|
( |
) |
|
Total operating lease liability |
|
$ |
|
(1) |
|
- current |
|
$ |
|
(2) |
|
- long-term |
|
|
|
(3) |
|
|
|
$ |
|
(1) |
|
The lease payments presented in the table above exclude amounts related to a failed sale-leaseback transaction. For information regarding the failed sale-leaseback transaction, refer to Note 15.
For information regarding the Company's related party leases, refer to Note 14.
102
8. PROPERTY, PLANT, AND EQUIPMENT
Property, plant, and equipment consisted of the following (in thousands):
|
|
June 30, 2026 |
|
|
June 30, 2025 |
|
||
Computer software |
|
$ |
|
|
$ |
|
||
Plant equipment |
|
|
|
|
|
|
||
Leasehold improvements |
|
|
|
|
|
|
||
Office furniture, and fixtures |
|
|
|
|
|
|
||
Computer equipment |
|
|
|
|
|
|
||
Building and other |
|
|
|
|
|
|
||
Total depreciable assets |
|
|
|
|
|
|
||
Less: Accumulated depreciation and amortization |
|
|
( |
) |
|
|
( |
) |
Property and equipment not placed in service |
|
|
|
|
|
|
||
Land |
|
|
|
|
|
|
||
Property, plant, and equipment, net |
|
$ |
|
|
$ |
|
||
Property, plant and equipment depreciation and amortization expense was $
9. GOODWILL AND INTANGIBLE ASSETS
Goodwill is an intangible asset that arises when a company acquires an existing business or assets (net of assumed liabilities) which comprise a business. In general, the amount of goodwill recorded in an acquisition is calculated as the purchase price of the business minus the fair market value of the tangible assets and the identifiable intangible assets, net of the assumed liabilities. Goodwill and intangibles can also be established by push-down accounting.
Carrying Value
The carrying value of goodwill and other purchased intangibles are described below (dollar amounts in thousands):
|
|
|
|
|
|
June 30, 2026 |
|
|
June 30, 2025 |
|
||||||||||||||||||||||||||
|
|
Estimated Useful Lives |
|
Remaining Weighted-Average Amortization Period |
|
Gross Carrying Amount |
|
|
Accumulated |
|
|
Accumulated |
|
|
Net Book Value |
|
|
Gross Carrying Amount |
|
|
Accumulated |
|
|
Accumulated |
|
|
Net Book Value |
|
||||||||
Identifiable intangible assets: |
|
|
|
|
|
|
|
|
|
|
|
|
|
|
|
|
|
|
|
|
|
|
|
|
|
|
||||||||||
Existing customer relationships |
|
|
|
$ |
|
|
$ |
( |
) |
|
$ |
— |
|
|
$ |
|
|
$ |
|
|
$ |
( |
) |
|
$ |
— |
|
|
$ |
|
||||||
Developed technology |
|
|
|
|
|
|
|
( |
) |
|
|
— |
|
|
|
|
|
|
|
|
|
( |
) |
|
|
— |
|
|
|
|
||||||
Proprietary knowhow |
|
|
|
|
|
|
|
( |
) |
|
|
— |
|
|
|
|
|
|
— |
|
|
|
— |
|
|
|
— |
|
|
|
— |
|
||||
Non-compete and other |
|
|
|
|
|
|
|
( |
) |
|
|
— |
|
|
|
|
|
|
|
|
|
( |
) |
|
|
— |
|
|
|
|
||||||
Employment agreement |
|
|
|
|
|
|
|
( |
) |
|
|
— |
|
|
|
— |
|
|
|
|
|
|
( |
) |
|
|
— |
|
|
|
— |
|
||||
Intangibles subject to amortization |
|
|
|
|
|
( |
) |
|
|
— |
|
|
|
|
|
|
|
|
|
( |
) |
|
|
— |
|
|
|
|
||||||||
Trade names and trademarks |
|
Indefinite |
|
Indefinite |
|
|
|
|
|
— |
|
|
|
( |
) |
|
|
|
|
|
|
|
|
— |
|
|
|
( |
) |
|
|
|
||||
Domain name |
|
Indefinite |
|
Indefinite |
|
|
|
|
|
— |
|
|
|
— |
|
|
|
|
|
|
|
|
|
— |
|
|
|
— |
|
|
|
|
||||
In-process research and development |
|
Indefinite |
|
Indefinite |
|
|
|
|
|
— |
|
|
|
— |
|
|
|
|
|
|
|
|
|
— |
|
|
|
— |
|
|
|
|
||||
Identifiable intangible assets |
|
$ |
|
|
$ |
( |
) |
|
$ |
( |
) |
|
$ |
|
|
$ |
|
|
$ |
( |
) |
|
$ |
( |
) |
|
$ |
|
||||||||
|
|
|
|
|
|
|
|
|
|
|
|
|
|
|
|
|
|
|
|
|
|
|
|
|
|
|
|
|
||||||||
Goodwill |
|
Indefinite |
|
Indefinite |
|
$ |
|
|
$ |
— |
|
|
$ |
( |
) |
|
$ |
|
|
$ |
|
|
$ |
— |
|
|
$ |
( |
) |
|
$ |
|
||||
The Company's intangible assets are subject to amortization except for trade names, trademarks, domain names and IPR&D, which have indefinite lives. Amortization expense related to the Company's intangible assets was $
103
The changes in the carrying amounts of goodwill were as follows (in thousands):
Balance as of June 30, 2024 |
|
$ |
|
|
Goodwill acquired - SGI - Wholesale Sales & Ancillary Services |
|
|
|
|
Goodwill acquired - SGI - Direct-to-Consumer |
|
|
|
|
Goodwill acquired - Pinehurst - Wholesale Sales & Ancillary Services |
|
|
|
|
Goodwill acquired - Pinehurst - Direct-to-Consumer |
|
|
|
|
Goodwill acquired - AMS - Direct-to-Consumer |
|
|
|
|
Balance as of June 30, 2025 |
|
|
|
|
Goodwill acquired - Monex - Direct-to-Consumer |
|
|
|
|
Goodwill acquired - SMI - Wholesale Sales & Ancillary Services |
|
|
|
|
Other |
|
|
( |
) |
Balance as of June 30, 2026 |
|
$ |
|
Impairment
We recorded a non-recurring impairment charge of $
Estimated Amortization
Estimated annual amortization expense related to definite-lived intangible assets for the succeeding five years and thereafter is as follows (in thousands):
Fiscal Year Ending June 30, |
|
Amount |
|
|
2027 |
|
$ |
|
|
2028 |
|
|
|
|
2029 |
|
|
|
|
2030 |
|
|
|
|
2031 |
|
|
|
|
Thereafter |
|
|
|
|
|
|
$ |
|
|
10. LONG-TERM INVESTMENTS
The following table shows the carrying value and ownership percentage of the Company's investment in privately-held entities accounted for either under the equity or cost method (in thousands):
|
|
June 30, 2026 |
|
|
June 30, 2025 |
|
|
||||||||||
Investee |
|
Carrying Value |
|
|
Ownership Percentage |
|
|
Carrying Value |
|
|
Ownership Percentage |
|
|
||||
Sunshine Minting, Inc.(1) |
|
|
|
|
|
% |
|
|
|
|
|
% |
|
||||
Company A |
|
|
|
|
|
% |
|
|
|
|
|
% |
|
||||
Company B |
|
|
|
|
|
% |
|
|
|
|
|
% |
|
||||
Texas Precious Metals, LLC |
|
|
|
|
|
% |
|
|
|
|
|
% |
|
||||
Atkinsons Bullion & Coins (2) |
|
|
|
|
|
% |
|
|
|
|
|
% |
|
||||
Company C |
|
|
|
|
|
% |
|
|
|
|
|
% |
|
||||
Company D |
|
|
|
|
|
% |
|
|
|
|
|
% |
|
||||
Company E |
|
|
|
|
|
% |
|
|
|
|
|
% |
|
||||
|
|
$ |
|
|
|
|
|
$ |
|
|
|
|
|
||||
We consider all of our equity method investees to be related parties. See Note 14 for a summary of the Company's aggregate balances and activity with these related party entities. All of the Company's investees are accounted for using the equity method, with the exception of Company A, which was accounted for using the cost method and was not considered a related party.
For equity method investments with greater than 20% ownership, the carrying value at June 30, 2026 exceeded our share of the investees' book value by $
104
11. ACCOUNTS PAYABLE AND OTHER CURRENT LIABILITIES
Accounts payable and other current liabilities consisted of the following (in thousands):
|
|
June 30, 2026 |
|
|
June 30, 2025 |
|
||
Trade payables to customers |
|
$ |
|
|
$ |
|
||
Other accounts payable |
|
|
|
|
|
|
||
Accounts payable and other payables |
|
$ |
|
|
$ |
|
||
|
|
|
|
|
|
|
||
Deferred revenue |
|
$ |
|
|
$ |
|
||
Advances from customers |
|
|
|
|
|
|
||
Deferred revenue and other advances |
|
$ |
|
|
$ |
|
||
As of June 30, 2026 and June 30, 2025, advances from customers included $
12. DERIVATIVE INSTRUMENTS AND HEDGING TRANSACTIONS
The Company is exposed to market risk, such as changes in commodity prices and foreign exchange rates. To manage the volatility related to these exposures, the Company enters into various derivative products, such as forward and futures contracts. By policy, the Company historically has entered into derivative financial instruments for the purpose of hedging substantially all of the Company's market exposure to precious metals prices, and not for speculative purposes. The Company’s gains (losses) on derivative instruments are substantially offset by the changes in the fair market value of the underlying precious metals inventory, both of which are recorded in cost of sales in the consolidated statements of income.
Commodity Price Management
The Company manages the value of certain assets and liabilities of its trading business, including trading inventory, by employing a variety of hedging strategies. These strategies include the management of exposure to changes in the market values of the Company's trading inventory through the purchase and sale of a variety of derivative instruments, such as forward and futures contracts.
The Company enters into derivative transactions solely for the purpose of hedging its inventory subject to price risk, and not for speculative market purposes. Due to the nature of the Company's global hedging strategy, the Company is not using hedge accounting as defined under ASC 815, whereby the gains or losses would be deferred and included as a component of other comprehensive income. Instead, gains or losses resulting from the Company's forward and futures contracts and open sale and purchase commitments are reported in the consolidated statements of income as unrealized gains or losses on commodity contracts (a component of cost of sales), with the related unrealized amounts due from or to counterparties reflected as derivative assets or liabilities on the consolidated balance sheets.
The Company's trading inventory and purchase and sale transactions consist primarily of precious metal products. The value of these assets and liabilities are marked-to-market daily to the prevailing closing price of the underlying precious metals. The Company's precious metals inventory is subject to fluctuations in market value, resulting from changes in the underlying commodity prices. Inventory purchased or borrowed by the Company is subject to price changes. Inventory borrowed is considered a natural hedge, since changes in value of the metal held are offset by the obligation to return the metal to the supplier.
Open sale and purchase commitments are subject to changes in value between the date the purchase or sale price is fixed (the trade date) and the date the metal is received or delivered (the settlement date). The Company seeks to minimize the effect of price changes of the underlying commodity through the use of forward and futures contracts. The Company’s open sale and purchase commitments typically settle within business days, and for those commitments that do not have stated settlement dates, the Company has the right to settle the positions upon demand.
The Company's policy is to substantially hedge its inventory position, net of open sale and purchase commitments that are subject to price risk, and regularly enters into precious metals commodity forward and futures contracts with financial institutions to hedge against this risk. The Company uses futures contracts, which typically settle within
The Company’s management sets credit and position risk limits. These limits include gross position limits for counterparties engaged in sales and purchase transactions with the Company. They also include collateral limits for different types of sale and purchase transactions that counterparties may engage in from time to time.
105
Derivative Assets and Liabilities
The Company's derivative assets and liabilities represent the net fair value of the difference (or intrinsic value) between market values and trade values at the trade date for open precious metals sale and purchase contracts, as adjusted on a daily basis for changes in market values of the underlying metals, until settled. The Company's derivative assets and liabilities also include the net fair value of open precious metals forward and futures contracts. The precious metals forward and futures contracts are settled at the contract settlement date.
All of our commodity derivative contracts are under master netting arrangements and include both asset and liability positions (i.e., offsetting derivative instruments). As such, for the Company's derivative contracts with the same counterparty, the receivables and payables have been netted on the consolidated balance sheets. Such derivative contracts include open sale and purchase commitments, futures, forward and margin accounts.
|
|
June 30, 2026 |
|
|
June 30, 2025 |
|
||||||||||||||||||||||||||
|
|
Gross |
|
|
Amounts |
|
|
Cash |
|
|
Net |
|
|
Gross |
|
|
Amounts |
|
|
Cash |
|
|
Net |
|
||||||||
Nettable derivative assets: |
|
|
|
|||||||||||||||||||||||||||||
Open sale and purchase commitments |
|
$ |
|
|
$ |
( |
) |
|
$ |
|
|
$ |
|
|
$ |
|
|
$ |
( |
) |
|
$ |
|
|
$ |
|
||||||
Futures contracts |
|
|
|
|
|
|
|
|
|
|
|
|
|
|
|
|
|
|
|
|
|
|
|
|
||||||||
Forward contracts |
|
|
|
|
|
|
|
|
|
|
|
|
|
|
|
|
|
|
|
|
|
|
|
|
||||||||
|
|
$ |
|
|
$ |
( |
) |
|
$ |
|
|
$ |
|
|
$ |
|
|
$ |
( |
) |
|
$ |
|
|
$ |
|
||||||
Nettable derivative liabilities: |
|
|
|
|
|
|
|
|
|
|
|
|
|
|
|
|
|
|
|
|
|
|
|
|
||||||||
Open sale and purchase commitments |
|
$ |
|
|
$ |
( |
) |
|
$ |
|
|
$ |
|
|
$ |
|
|
$ |
( |
) |
|
$ |
|
|
$ |
|
||||||
Margin accounts |
|
|
|
|
|
|
|
|
( |
) |
|
|
|
|
|
( |
) |
|
|
|
|
|
|
|
|
|
||||||
Futures contracts |
|
|
|
|
|
|
|
|
|
|
|
|
|
|
|
|
|
|
|
|
|
|
|
|
||||||||
Forward contracts |
|
|
|
|
|
|
|
|
|
|
|
|
|
|
|
|
|
|
|
|
|
|
|
|
||||||||
|
|
$ |
|
|
$ |
( |
) |
|
$ |
( |
) |
|
$ |
|
|
$ |
|
|
$ |
( |
) |
|
$ |
|
|
$ |
|
|||||
Gains or Losses on Derivative Instruments
The Company records the derivative at the trade date with corresponding unrealized gains or losses shown as a component of cost of sales in the consolidated statements of income. The Company adjusts the derivatives to fair value on a daily basis until the transactions are settled. When these contracts are net settled, the unrealized gains and losses are reversed, and the realized gains and losses for forward contracts are recorded in revenue and cost of sales, respectively, and the net realized gains and losses for futures contracts are recorded in cost of sales.
Below is a summary of the net gains (losses) on derivative instruments (in thousands):
|
|
|
Year Ended June 30, |
|
|||||||||
|
|
|
2026 |
|
|
2025 |
|
|
2024 |
|
|||
Gains (losses) on derivative instruments: |
|
|
|
|
|
|
|||||||
Unrealized gains (losses) on open futures commodity and forward contracts and open sale and purchase commitments, net |
|
|
$ |
|
|
$ |
( |
) |
|
$ |
|
||
|
|
|
( |
) |
|
|
( |
) |
|
|
( |
) |
|
|
|
|
$ |
|
|
$ |
( |
) |
|
$ |
|
||
The Company’s net gains (losses) on derivative instruments, as shown in the table above, were substantially offset by the changes in the fair market value of the underlying precious metals inventory, which were also recorded in cost of sales in the consolidated statements of income.
106
Summary of Hedging Positions
In a hedging relationship, the change in the value of the derivative financial instrument is offset to a great extent by the change in the value of the underlying hedged item.
|
|
June 30, 2026 |
|
|
June 30, 2025 |
|
||
Inventories |
|
$ |
|
|
$ |
|
||
|
|
|
|
|
|
|
||
Less unhedgeable inventories: |
|
|
|
|
|
|
||
Collectible coin inventory, held at lower of cost or net realizable value |
|
|
( |
) |
|
|
( |
) |
Premium on metals position |
|
|
( |
) |
|
|
( |
) |
Precious metal value not hedged |
|
|
( |
) |
|
|
( |
) |
|
|
|
|
|
|
|
||
Commitments at market: |
|
|
|
|
|
|
||
Open inventory purchase commitments |
|
|
|
|
|
|
||
Open inventory sales commitments |
|
|
( |
) |
|
|
( |
) |
Margin sales commitments |
|
|
( |
) |
|
|
( |
) |
In-transit inventory no longer subject to market risk |
|
|
( |
) |
|
|
( |
) |
Unhedgeable premiums on open commitment positions |
|
|
|
|
|
|
||
Borrowed precious metals |
|
|
( |
) |
|
|
( |
) |
Product financing arrangements |
|
|
( |
) |
|
|
( |
) |
Advances on industrial metals |
|
|
|
|
|
|
||
|
|
|
( |
) |
|
|
|
|
|
|
|
|
|
|
|
||
Precious metals inventory subject to price risk |
|
|
|
|
|
|
||
|
|
|
|
|
|
|
||
Precious metals subject to derivative financial instruments: |
|
|
|
|
|
|
||
Precious metals forward contracts at market values |
|
|
( |
) |
|
|
|
|
Precious metals futures contracts at market values |
|
|
|
|
|
|
||
Total market value of derivative financial instruments |
|
|
|
|
|
|
||
|
|
|
|
|
|
|
||
Net precious metals inventory subject to commodity price risk |
|
$ |
|
|
$ |
( |
) |
|
Notional Balances of Derivatives
The notional balances of the Company's derivative instruments, consisting of contractual metal quantities, are expressed at current spot prices of the underlying precious metal commodity.
|
|
June 30, 2026 |
|
|
June 30, 2025 |
|
||
Purchase commitments |
|
$ |
|
|
$ |
|
||
Sales commitments |
|
$ |
( |
) |
|
$ |
( |
) |
Margin sales commitments |
|
$ |
( |
) |
|
$ |
( |
) |
Open forward contracts |
|
$ |
( |
) |
|
$ |
|
|
Open futures contracts |
|
$ |
|
|
$ |
|
||
The contract amounts (i.e., notional balances) of the Company's forward and futures contracts and the open sales and purchase commitments are not reflected in the accompanying consolidated balance sheets. The Company records the difference between the market price of the underlying metal or contract and the trade amount at fair value.
The Company is exposed to the risk of failure of the counterparties to its derivative contracts. Significant judgment is applied by the Company when evaluating the fair value implications. The Company regularly reviews the creditworthiness of its major counterparties and monitors its exposure to concentrations. As of June 30, 2026, the Company believes its risk of counterparty default is mitigated as a result of such evaluation and the short-term duration of these arrangements.
Foreign Currency Exchange Rate Management
The Company utilizes foreign currency forward contracts to manage the effect of foreign currency exchange fluctuations on its sale and purchase transactions. These contracts generally have maturities of less than one week.
|
|
June 30, 2026 |
|
|
June 30, 2025 |
|
||
Foreign exchange forward contracts |
|
$ |
|
|
$ |
|
||
Open sale and purchase commitment transactions, net |
|
$ |
|
|
$ |
|
||
107
13. INCOME TAXES
Net income from operations before provision for income taxes is shown below (in thousands):
|
|
|
Year Ended June 30, |
|
|||||||||
|
|
|
2026 |
|
|
2025 |
|
|
2024 |
|
|||
U.S. |
|
|
$ |
|
|
$ |
|
|
$ |
|
|||
Foreign |
|
|
|
|
|
|
( |
) |
|
|
( |
) |
|
|
|
|
$ |
|
|
$ |
|
|
$ |
|
|||
The Company files a consolidated federal income tax return based on a June 30 tax year end. The provision for income tax expense by jurisdiction and the effective tax rate are shown below (in thousands):
|
|
|
Year Ended June 30, |
|
|||||||||
|
|
|
2026 |
|
|
2025 |
|
|
2024 |
|
|||
Current: |
|
|
|
|
|
|
|
|
|
|
|||
Federal |
|
|
$ |
|
|
$ |
|
|
$ |
|
|||
State and local |
|
|
|
|
|
|
|
|
|
|
|||
Foreign |
|
|
|
|
|
|
|
|
|
|
|||
|
|
|
$ |
|
|
$ |
|
|
$ |
|
|||
Deferred: |
|
|
|
|
|
|
|
|
|
|
|||
Federal |
|
|
|
( |
) |
|
|
( |
) |
|
|
( |
) |
State and local |
|
|
|
( |
) |
|
|
( |
) |
|
|
( |
) |
Foreign |
|
|
|
( |
) |
|
|
( |
) |
|
|
( |
) |
|
|
|
|
( |
) |
|
|
( |
) |
|
|
( |
) |
|
|
|
|
|
|
|
|
|
|
|
|||
Income tax expense |
|
|
$ |
|
|
$ |
|
|
$ |
|
|||
|
|
|
|
|
|
|
|
|
|
|
|||
Effective income tax rate |
|
|
|
% |
|
|
% |
|
|
% |
|||
Our provision for income taxes varied from the tax computed at the U.S. federal statutory income tax rates for the year ended June 30, 2026, 2025, and 2024 primarily due to the effects of state and local income taxes, net of federal tax benefit, excess tax benefit from share-based compensation, acquisition-related adjustments, and other permanent differences. Fiscal 2026 also included U.S. foreign tax credits, foreign tax effects related principally to Hong Kong operations, and tax effects of entity reorganization. Fiscal 2025 included one-time tax effects related to the Company's acquisitions of Pinehurst and AMS and related transaction costs. Fiscal 2024 included a one-time tax adjustment related to the Company's acquisition of SGB.
We adopted ASU 2023-09 prospectively. Pursuant to the requirements of ASU 2023-09, a reconciliation of the income tax provision to the amounts computed by applying the statutory federal income tax rate to income before tax for the year ended June 30, 2026 are set forth below (in thousands):
|
|
$ |
|
|
|
% |
|||
State and local tax, net of federal benefit (1) |
|
|
|
|
|
|
% |
||
Foreign tax effects: |
|
|
|
|
|
|
|
||
Hong Kong: |
|
|
|
|
|
|
|
||
Tax rate differential |
|
|
|
( |
) |
|
|
( |
%) |
Permanent nondeductible |
|
|
|
|
|
|
% |
||
Other |
|
|
|
|
|
|
% |
||
Other foreign jurisdictions |
|
|
|
|
|
|
% |
||
Tax credits |
|
|
|
( |
) |
|
|
( |
%) |
Nontaxable or nondeductible items: |
|
|
|
|
|
|
|
||
Share-based compensation |
|
|
|
( |
) |
|
|
( |
%) |
Adjustments related to acquisitions |
|
|
|
( |
) |
|
|
( |
%) |
Other permanent items |
|
|
|
( |
) |
|
|
( |
%) |
Other |
|
|
|
( |
) |
|
|
( |
%) |
|
|
|
$ |
|
|
|
% |
||
108
As previously disclosed for the years ended June 30, 2025 and 2024, prior to the adoption of ASU 2023-09, the items accounting for the difference between income taxes computed at the U.S. federal statutory rate and our effective tax rate were as follows (in thousands):
|
|
Year Ended June 30, |
|||||
|
|
2025 |
|
2024 |
|
||
|
$ |
|
$ |
|
|||
State and local tax, net of federal benefit |
|
|
|
|
|
||
Adjustment related to acquisitions |
|
|
|
|
( |
|
|
Foreign derived intangible income |
|
|
( |
|
|
( |
|
Stock-based compensation |
|
|
( |
|
|
( |
|
State rate change |
|
|
|
|
|
( |
|
Permanent adjustments |
|
|
|
|
|
||
Foreign rate differential |
|
|
( |
|
|
|
|
Foreign withholding taxes |
|
|
|
|
|
||
Other |
|
( |
|
|
|||
|
|
$ |
|
$ |
|
||
The following table summarizes income taxes paid, net of refunds for the year ended June 30, 2026 (in thousands):
Federal (United States) |
|
|
$ |
|
|
State |
|
|
|
|
|
Foreign: |
|
|
|
|
|
Hong Kong |
|
|
|
|
|
Canada |
|
|
|
|
|
Other |
|
|
|
|
|
|
|
|
$ |
|
|
Income taxes paid, net of refunds, during the years ended June 30, 2025 and 2024 were $
As of June 30, 2026 and June 30, 2025, we had an income tax receivable of $
In assessing the realizability of deferred tax assets, management considers whether it is more likely than not that some portion or all of the deferred tax assets will be realized by evaluating both positive and negative evidence. The ultimate realization of deferred tax assets is dependent upon the generation of future taxable income during the periods in which those temporary differences become deductible. As of June 30, 2026 and June 30, 2025, management concluded that it was more likely than not that the Company would be able to realize the benefit of the U.S. federal and state deferred tax assets. We based this conclusion on historical and projected operating performance, as well as our expectation that our operations will generate sufficient taxable income in future periods to realize the tax benefits associated with the deferred tax assets. A tax valuation allowance was considered unnecessary, as management concluded that it was more likely than not that the Company would be able to realize the benefit of the U.S. federal and state deferred tax assets.
As of June 30, 2026, the consolidated balance sheet reflects the deferred tax items for each tax-paying component (i.e., federal, state and foreign), resulting in a federal deferred tax liability of $
109
The schedule of deferred taxes presented below summarizes the components of deferred taxes that have been classified as deferred tax assets and liabilities related to taxable and deductible temporary differences (in thousands):
|
|
June 30, 2026 |
|
|
June 30, 2025 |
|
||
Accruals and reserves |
|
$ |
|
|
$ |
|
||
Lease liabilities |
|
|
|
|
|
|
||
Share-based compensation |
|
|
|
|
|
|
||
State tax accrual |
|
|
|
|
|
|
||
Net operating loss carryforwards |
|
|
|
|
|
|
||
Business interest expense disallowance |
|
|
|
|
|
|
||
Capitalized costs |
|
|
|
|
|
|
||
Investment in partnership |
|
|
|
|
|
|
||
Other |
|
|
|
|
|
|
||
Deferred tax assets |
|
|
|
|
|
|
||
Less: valuation allowances |
|
|
|
|
|
|
||
|
|
|
|
|
|
|
||
Deferred tax assets after valuation allowances |
|
|
|
|
|
|
||
|
|
|
|
|
|
|
||
Intangible assets |
|
|
( |
) |
|
|
( |
) |
Fixed assets |
|
|
( |
) |
|
|
( |
) |
Earnings from equity method investment |
|
|
( |
) |
|
|
( |
) |
Investment in partnership |
|
|
|
|
|
( |
) |
|
Right of use assets |
|
|
( |
) |
|
|
( |
) |
Other |
|
|
( |
) |
|
|
( |
) |
Deferred tax liabilities |
|
|
( |
) |
|
|
( |
) |
|
|
|
|
|
|
|
||
Net deferred tax liability |
|
$ |
( |
) |
|
$ |
( |
) |
We acquired $
The Company has taken or expects to take certain tax benefits on its income tax return filings that it has not recognized as a tax benefit (i.e., an unrecognized tax benefit) on its consolidated statements of income. The Company's measurement of its uncertain tax positions is based on management's assessment of all relevant information, including, but not limited to prior audit experience, audit settlement, or lapse of the applicable statute of limitations.
|
|
|
Year Ended June 30, |
|
|||||||||
|
|
|
2026 |
|
|
2025 |
|
|
2024 |
|
|||
Beginning balance |
|
|
$ |
|
|
$ |
|
|
$ |
|
|||
Reductions due to lapse of statute of limitations |
|
|
|
( |
) |
|
|
( |
) |
|
|
( |
) |
Additions as a result of acquired tax positions |
|
|
|
|
|
|
|
|
|
|
|||
|
|
|
$ |
|
|
$ |
|
|
$ |
|
|||
In addition to the $
110
Related parties include entities which the Company controls or has the ability to significantly influence, and entities which are under common control with the Company. Related parties also include persons who are affiliated with related entities or the Company who are in a position to influence corporate decisions (such as owners, executives, board members and their families). In the normal course of business, we enter into transactions with our related parties. In addition to our directors and officers and one individual who is the beneficial owner of more than
Our related party transactions primarily include (i) sales and purchases of precious metals, (ii) financing activities, (iii) repurchase arrangements, (iv) hedging transactions, and (v) related party facility lease and construction arrangements. Below is a summary of our related party transactions. The amounts presented for each period reflect each entity’s related party status for that period.
Balances with Related Parties
Receivables and Payables and Customer Advances, Net
Our related party net receivables as well as payables and customer advances balances were as shown below (in thousands):
|
|
June 30, 2026 |
|
June 30, 2025 |
||||||||||||||||
|
|
Receivables |
|
Payables and Advances |
|
Receivables |
|
Payables and Advances |
||||||||||||
Equity method investees |
|
|
|
|
|
|
|
|
|
|
|
|
|
|
|
|
||||
Tether |
|
|
|
|
|
|
|
|
|
|
|
|
|
|
|
|
||||
Other |
|
|
|
|
|
|
|
|
|
|
|
|
|
|
|
|
||||
|
|
$ |
|
|
|
$ |
|
|
|
$ |
|
|
|
$ |
|
|
||||
Stablecoins
The Company purchased stablecoins from Tether called XAU₮ tokens in April 2026 which are recorded within prepaid and other current assets on the consolidated balance sheets. See further information in Note 2.
Operating Lease Right of Use Assets
As of June 30, 2026 and June 30, 2025, our related party right of use assets were $
Property, Plant, and Equipment
AMGL entered into an agreement, effective as of July 1, 2024, with W.A. Richardson Builders, LLC (“WAR Construction”) to effectuate the build out of the Company’s Las Vegas logistics facility which was completed in fiscal 2025. The majority owner and co-manager of WAR Construction is the spouse of a non-employee member of the Board of Directors of the Company, and the other co-manager is a
111
Long-term Investments
As of June 30, 2026 and June 30, 2025, the aggregate carrying balance of our equity method investments was $
Notes Payable
On April 1, 2021, CCP entered into a loan agreement ("CCP Note") with CFC, which provides CFC with up to $
In June 2024, SGB declared a $
In February 2025 in connection with the acquisition of Pinehurst, the Company assumed a promissory note with the former majority owner of Pinehurst for $
Share Repurchases
In November 2024, we repurchased
Activity with Related Parties
Revenues and Cost of Sales
Our revenues and cost of sales with related parties were as follows (in thousands):
|
|
|
Year Ended June 30, |
|||||||||||||||||||||||
|
|
|
2026 |
|
|
2025 |
|
|
2024 |
|||||||||||||||||
|
|
|
Revenues |
|
|
Cost of Sales |
|
|
Revenues |
|
|
Cost of Sales |
|
|
Revenues |
|
|
Cost of Sales |
||||||||
Stack's Bowers Galleries(1) |
|
|
$ |
|
|
$ |
|
|
$ |
|
|
$ |
|
|
$ |
|
|
$ |
|
|
||||||
Equity method investees(2) |
|
|
|
|
|
|
|
|
|
|
|
|
|
|
|
|
|
|
|
|
||||||
Tether |
|
|
|
|
|
|
|
|
|
|
|
|
|
|
|
|
|
|
|
|
||||||
|
|
|
$ |
|
|
$ |
|
|
$ |
|
|
$ |
|
|
$ |
|
|
$ |
|
|
||||||
Interest Income and Expense
We recorded interest income and expense from related parties as set forth below (in thousands):
|
|
|
Year Ended June 30, |
|
|
|||||||||
|
|
|
2026 |
|
|
2025 |
|
|
2024 |
|
|
|||
Interest income from secured loans receivables |
|
|
$ |
|
|
$ |
|
|
$ |
|
|
|||
Interest income from finance products and repurchase arrangements |
|
|
|
|
|
|
|
|
|
|
|
|||
|
|
|
$ |
|
|
$ |
|
|
$ |
|
|
|||
|
|
|
|
|
|
|
|
|
|
|
|
|||
Interest expense from note payables |
|
|
$ |
|
|
$ |
|
|
$ |
|
|
|||
Interest expense from precious metals leases |
|
|
|
|
|
|
|
|
|
|
|
|||
|
|
|
$ |
|
|
$ |
|
|
$ |
|
|
|||
Selling, General, and Administrative Expense
The Company incurred selling, general, and administrative expense related to its related party leasing agreements and consulting agreements of $
Equity Method Investments — Earnings, Dividends and Distributions Received
The Company's proportional share of our equity method investee's earnings (losses) totaled $
The Company received dividend and distribution payments from our equity method investees that totaled, in the aggregate, $
112
Other Income
The Company earned royalty and consulting services income from related parties that totaled $
Transactions with Directors and Officers
Directors and officers of the Company engaged in transactions through the Company for an aggregate dollar value of $
15. FINANCING AGREEMENTS
Lines of Credit - Trading Credit Facility
On December 21, 2021, the Company entered into a three-year committed facility provided by a syndicate of financial institutions (the “Trading Credit Facility”), with a total revolving commitment of up to $
The Trading Credit Facility is secured by substantially all of the Company’s assets on a first priority basis and is guaranteed by the Company's subsidiaries. The Trading Credit Facility currently bears interest at the daily rate plus an applicable margin of
When needed, we use funds drawn under the Trading Credit Facility to purchase metals from our suppliers and for operating cash flow purposes. Our CFC subsidiary also uses funds drawn under the Trading Credit Facility to finance certain of its lending activities.
Borrowings totaled $
The Trading Credit Facility contains various covenants, all of which the Company was in compliance with as of June 30, 2026.
Interest expense related to the Company’s Trading Credit Facility totaled $
Leaseback Financing Obligation
As part of the acquisition of AMS in April 2025, the Company assumed a leaseback financing obligation related to AMS's offices in Eagan, Minnesota. The original transaction, entered into by AMS in August 2024, involved the sale of the property followed by a leaseback arrangement. Due to certain economic terms of the lease, the transaction did not qualify for sale-leaseback accounting. Under a failed sale-leaseback arrangement, the property is accounted for as property, plant, and equipment, and the lease is accounted for as a financing obligation.
113
The carrying amount of the leaseback financing obligation as of June 30, 2026 was $
Fiscal Year ending June 30, |
|
Financing Payments (Undiscounted) |
|
|
|
2027 |
|
$ |
|
|
|
2028 |
|
|
|
|
|
2029 |
|
|
|
|
|
2030 |
|
|
|
|
|
2031 |
|
|
|
|
|
Thereafter |
|
|
|
|
|
Total future payments |
|
|
|
|
|
Imputed interest |
|
|
( |
) |
|
Present value (1) |
|
$ |
|
|
|
The Company has recorded the current portion of this obligation within accrued liabilities and the noncurrent portion within other liabilities in its consolidated balance sheet, with related interest expense recognized in the consolidated statement of operations. The total interest expense incurred during the years ended June 30, 2026 and 2025 was $
Notes Payable — Related Party
See Note 14.
Liabilities on Borrowed Metals and Precious Metals Leases
Liabilities on Borrowed Metals
Liabilities may also arise from: (i) metal positions held by customers in the Company’s inventory, (ii) amounts due to suppliers for the use of their consigned inventory, and (iii) shortages in unallocated metal positions held by the Company in the supplier’s inventory, and (iv) advanced pool metals borrowed under short-term agreements using other precious metals from its inventory as collateral. Unallocated or pool metal represents an unsegregated inventory position that is due on demand, in a specified physical form, based on the total ounces of metal held in the position. Amounts due under these arrangements require delivery either in the form of precious metals or in cash.
The Company recorded liabilities on borrowed metals with market values totaling $
Precious Metals Leases
The Company leases precious metals from its suppliers and customers under short-term arrangements, in which the lease terms and interest rates are established at lease inception. The Company has the ability to sell the metals advanced. These arrangements can be settled by repayment in similar metals or in cash.
Precious metals leases of $
For the years ended June 30, 2026, 2025, and 2024, the interest expense related to liabilities on borrowed metals and precious metals leases totaled $
114
Product Financing Arrangements
The Company has agreements with third-party financial institutions which allow the Company to transfer its gold and silver inventory at an agreed-upon price, which is based on the spot price. Such agreements allow the Company to repurchase this inventory upon demand at an agreed-upon price based on the spot price on the repurchase date. The third-party charges a monthly fee as a percentage of the market value of the outstanding obligation; such monthly charges are classified in interest expense. These transactions do not qualify as sales, and therefore have been accounted for as financing arrangements and are reflected in the consolidated balance sheet as product financing arrangements. The obligation is stated at the amount required to repurchase the outstanding inventory. Both the product financing obligation and the underlying inventory (which is entirely restricted) are carried at fair value, with changes in fair value recorded as a component of cost of sales in the consolidated statements of income. Such obligations totaled $
For the years ended June 30, 2026, 2025, and 2024, the interest expense related to product financing arrangements totaled $
16. COMMITMENTS AND CONTINGENCIES
Legal Matters
The Company is from time-to-time party to various lawsuits, claims and other proceedings, that arise in the ordinary course of its business.
Although the ultimate outcome of any legal matter cannot be predicted with certainty, based on current information, including our assessment of the merits of the particular claim, we do not expect that these legal proceedings or claims will have any material adverse impact on our future consolidated financial position, results of operations, or cash flows.
In accordance with U.S. GAAP, we review the need to accrue for any loss contingency and establish a liability when, in the opinion of management, it is probable that a matter would result in a liability and the amount of loss, if any, can be reasonably estimated. We do not believe that the resolution of any currently pending lawsuits, claims and proceedings, either individually or in the aggregate, will have a material adverse effect on financial position, results of operations or liquidity. However, the outcomes of any currently pending lawsuits, claims and proceedings cannot be predicted, and therefore, there can be no assurance that this will be the case.
Additionally, we record receivables for insurance recoveries relating to litigation-related losses and expenses if and when such amounts are covered by insurance and recovery of such losses or expenses are due.
Employment and Non-Compete Agreements
As of June 30, 2026, the Company was a party to various employment agreements and non-compete and/or non-solicitation agreements with its employees, including employment agreements with (a) Gregory Roberts, our Chief Executive Officer, which expires in June 2027, (b) Thor Gjerdrum, our President, which expires in June 2028, (c) Brian Aquilino, our Chief Operating Officer, which expires in June 2028, and (d) Robert Pacelli, Executive Vice President of Innovation and Strategic Initiatives and Chief Executive Officer and President of JMB, which expires in June 2029. The Company's employment agreement with Michael Wittmeyer, formerly Chief Executive Officer of JMB, was terminated as of June 30, 2023, at which time the Company and Mr. Wittmeyer entered into a consulting agreement, which expires in June 2027. The employment agreements provide for minimum salary levels, incentive compensation and severance benefits, among other items, and the employment agreements and the consulting agreement contain various non-compete and non-solicitation provisions.
Employee Benefit Plan
The Company maintains an employee retirement savings plan for United States employees under the Internal Revenue Code section 401(k). The Company matches a percentage of each employee's contributions in accordance with plan terms. The Company's matching 401(k) contributions totaled $
17. STOCKHOLDERS’ EQUITY
Dividends
Dividends are recorded if and when they are declared by the board of directors.
115
On
On
On
On
Share Repurchase Program
The Company has an ongoing share repurchase program authorizing the purchase of up to
Tether Investment
In February 2026, the Company entered into a definitive agreement with Tether, whereby Tether purchased $
2014 Stock Award and Incentive Plan
The Company's amended and restated 2014 Stock Award and Incentive Plan (the "2014 Plan") was approved most recently on October 27, 2022 by the Company's stockholders. As of June 30, 2026,
Stock Options
The Company measures the compensation cost of stock options using the Black-Scholes option pricing model, which uses various inputs such as the market price per share of common stock and estimates that include the risk-free interest rate, volatility, expected life and dividend yield.
|
|
Year Ended June 30, |
|||||
|
|
2026 |
|
2025 |
|
|
2024 |
Average volatility |
|
|
|
|
n/a (1) |
||
Risk-free interest rate |
|
|
|
|
n/a (1) |
||
Weighted-average expected life in years |
|
|
|
|
n/a (1) |
||
Dividend yield rate annual |
|
|
|
|
n/a (1) |
||
The expected volatility was based on a combination of the historical volatility of the Company’s common stock over a period commensurate with the expected term and the implied volatility derived from the market prices of the traded options. The risk-free interest rate was derived from the average U.S. Treasury yields with a term matching the expected life of the option. To date, the Company has used the simplified method to estimate the expected term as sufficient historical exercise data has not been available. The simplified method calculates the expected term as the midpoint between the vesting and contractual terms. The dividend yield was based on the historical and expected dividend payouts as of the respective award grant dates.
116
The Company incurred compensation expense related to stock options of $
The following table summarizes stock option activity:
|
|
Options |
|
|
Weighted-Average Exercise Price Per Share |
|
|
Aggregate |
|
|
Weighted-Average Grant Date Fair Value Per Award (1) |
|
||||
Fiscal 2024 |
|
|
|
|
|
|
|
|
|
|
|
|
||||
Outstanding at June 30, 2023 |
|
|
|
|
$ |
|
|
$ |
|
|
$ |
|
||||
Exercises |
|
|
( |
) |
|
$ |
|
|
$ |
|
|
$ |
|
|||
Outstanding at June 30, 2024 |
|
|
|
|
$ |
|
|
$ |
|
|
$ |
|
||||
Nonvested outstanding June 30, 2024 |
|
|
|
|
$ |
|
|
$ |
|
|
$ |
|
||||
Exercisable at June 30, 2024 |
|
|
|
|
$ |
|
|
$ |
|
|
$ |
|
||||
|
|
|
|
|
|
|
|
|
|
|
|
|
||||
Fiscal 2025 |
|
|
|
|
|
|
|
|
|
|
|
|
||||
Outstanding at June 30, 2024 |
|
|
|
|
$ |
|
|
$ |
|
|
$ |
|
||||
Grants |
|
|
|
|
$ |
|
|
$ |
— |
|
|
$ |
|
|||
Exercises |
|
|
( |
) |
|
$ |
|
|
$ |
|
|
$ |
|
|||
Outstanding at June 30, 2025 |
|
|
|
|
$ |
|
|
$ |
|
|
$ |
|
||||
Nonvested outstanding June 30, 2025 |
|
|
|
|
$ |
|
|
$ |
|
|
$ |
|
||||
Exercisable at June 30, 2025 |
|
|
|
|
$ |
|
|
$ |
|
|
$ |
|
||||
|
|
|
|
|
|
|
|
|
|
|
|
|
||||
Fiscal 2026 |
|
|
|
|
|
|
|
|
|
|
|
|
||||
Outstanding at June 30, 2025 |
|
|
|
|
$ |
|
|
$ |
|
|
$ |
|
||||
Grants |
|
|
|
|
$ |
|
|
$ |
|
|
$ |
|
||||
Exercises |
|
|
( |
) |
|
$ |
|
|
$ |
|
|
$ |
|
|||
Forfeitures |
|
|
( |
) |
|
$ |
|
|
$ |
|
|
$ |
|
|||
Outstanding at June 30, 2026 |
|
|
|
|
$ |
|
|
$ |
|
|
$ |
|
||||
Nonvested outstanding June 30, 2026 |
|
|
|
|
$ |
|
|
$ |
|
|
$ |
|
||||
Exercisable at June 30, 2026 |
|
|
|
|
$ |
|
|
$ |
|
|
$ |
|
||||
The following table presents information related to outstanding options as of June 30, 2026:
Exercise Price Ranges |
|
|
Options Outstanding |
|
|
Options Exercisable |
|
|||||||||||||||||||||||
From |
|
|
To |
|
|
Number of |
|
|
Weighted-Average Remaining Contractual Life |
|
|
Weighted-Average Exercise Price |
|
|
Number of |
|
|
Weighted-Average Remaining Contractual Life |
|
|
Weighted-Average Exercise Price |
|
||||||||
$ |
|
|
$ |
|
|
|
|
|
|
|
|
$ |
|
|
|
|
|
|
|
|
$ |
|
||||||||
$ |
|
|
$ |
|
|
|
|
|
|
|
|
$ |
|
|
|
|
|
|
|
|
$ |
|
||||||||
$ |
|
|
$ |
|
|
|
|
|
|
|
|
$ |
|
|
|
|
|
|
|
|
$ |
|
||||||||
$ |
|
|
$ |
|
|
|
|
|
|
|
|
$ |
|
|
|
|
|
|
|
|
$ |
|
||||||||
$ |
|
|
$ |
|
|
|
|
|
|
|
|
$ |
|
|
|
|
|
|
7.01 |
|
|
$ |
|
|||||||
|
|
|
|
|
|
|
|
|
|
|
|
$ |
|
|
|
|
|
|
|
|
$ |
|
||||||||
Restricted Stock Units
RSUs granted by the Company are not transferable and automatically convert to shares of common stock on a one-for-one basis as the awards vest or at a specified date after vesting. RSUs granted to a non-U.S. citizen are referred to as "deferred stock units" or "DSUs". The Company measures the compensation cost of RSUs based on the closing price of the underlying shares at the grant date. The Company recognizes forfeitures as they occur.
117
The Company incurred compensation expense related to RSUs of $
|
|
Awards |
|
|
|
Weighted-Average Fair Value per Unit at Grant Date |
|
|
||
Fiscal 2024 |
|
|
|
|
|
|
|
|
||
Nonvested outstanding at June 30, 2023 |
|
|
|
|
|
$ |
|
|
||
Granted |
|
|
|
|
|
$ |
|
|
||
Vested & delivered |
|
|
( |
) |
|
|
$ |
|
|
|
Vested & deferred (1) |
|
|
( |
) |
|
|
$ |
|
|
|
Forfeited |
|
|
( |
) |
|
|
$ |
|
|
|
Nonvested outstanding at June 30, 2024 |
|
|
|
|
|
$ |
|
|
||
Vested but subject to deferred settlement at June 30, 2024 (1) |
|
|
|
|
|
$ |
|
|
||
Outstanding at June 30, 2024 |
|
|
|
|
|
$ |
|
|
||
Fiscal 2025 |
|
|
|
|
|
|
|
|
||
Nonvested outstanding at June 30, 2024 |
|
|
|
|
|
$ |
|
|
||
Granted |
|
|
|
|
|
$ |
|
|
||
Vested & delivered |
|
|
( |
) |
|
|
$ |
|
|
|
Vested & deferred (1) |
|
|
( |
) |
|
|
$ |
|
|
|
Forfeited |
|
|
( |
) |
|
|
$ |
|
|
|
Nonvested outstanding at June 30, 2025 |
|
|
|
|
|
$ |
|
|
||
Vested but subject to deferred settlement at June 30, 2025 (1) |
|
|
|
|
|
$ |
|
|
||
Outstanding at June 30, 2025 |
|
|
|
|
|
$ |
|
|
||
Fiscal 2026 |
|
|
|
|
|
|
|
|
||
Nonvested outstanding at June 30, 2025 |
|
|
|
|
|
$ |
|
|
||
Granted |
|
|
|
|
|
$ |
|
|
||
Vested & delivered |
|
|
( |
) |
|
|
$ |
|
|
|
Vested & deferred (1) |
|
|
( |
) |
|
|
$ |
|
|
|
Forfeited |
|
|
( |
) |
|
|
$ |
|
|
|
Nonvested outstanding at June 30, 2026 |
|
|
|
|
|
$ |
|
|
||
Vested but subject to deferred settlement at June 30, 2026 (1) |
|
|
|
|
|
$ |
|
|
||
Outstanding at June 30, 2026 |
|
|
|
|
|
$ |
|
|
||
Cash Incentive Bonus Award
Effective in the first quarter of fiscal 2024, the Company granted its chief executive officer a cash incentive bonus payable at the end of the fiscal 2024–2027 term, based on
Compensation expense is recognized on a straight-line basis over the performance period, with the amount recognized fluctuating due to remeasurement of fair value at the end of each reporting period. The Company recognized compensation expense (income) related to this cash incentive bonus award of $
118
18. CUSTOMER AND SUPPLIER CONCENTRATIONS
Customer Concentrations
The following customers provided 10 percent or more of the Company's revenues (in thousands):
|
|
|
Year Ended June 30, |
|
|
|||||||||||||||||||||
|
|
|
2026 |
|
|
2025 |
|
|
2024 |
|
|
|||||||||||||||
|
|
|
Amount |
|
|
Percent |
|
|
Amount |
|
|
Percent |
|
|
Amount |
|
|
Percent |
|
|
||||||
Total revenue |
|
|
$ |
|
|
|
% |
|
$ |
|
|
|
% |
|
$ |
|
|
|
% |
|
||||||
Customer concentrations |
|
|
|
|
|
|
|
|
|
|
|
|
|
|
|
|
|
|
|
|
||||||
Deutsche Bank (1) |
|
|
|
|
|
|
% |
|
|
|
|
|
% |
|
$ |
|
|
|
% |
|
||||||
No single customer provided 10 percent or more of the Company's accounts receivable balances as of June 30, 2026.
The following customer accounted for 10 percent or more of the Company's secured loans balances (in thousands):
|
|
June 30, 2026 |
|
|
June 30, 2025 |
|
||||||||||
|
|
Amount |
|
|
Percent |
|
|
Amount |
|
|
Percent |
|
||||
Total secured loans receivable |
|
$ |
|
|
|
% |
|
$ |
|
|
|
% |
||||
Customer concentrations |
|
|
|
|
|
|
|
|
|
|
|
|
||||
Customer A |
|
$ |
|
|
|
% |
|
$ |
|
|
|
% |
||||
Supplier Concentrations
The Company buys precious metals from a variety of sources, including through brokers and dealers, from sovereign and private mints, from refiners and directly from customers. The Company believes that no one supplier or small group of suppliers is critical to its business, since other sources of supply are available that provide similar products on comparable terms.
19. SEGMENTS AND GEOGRAPHIC INFORMATION
The Company identifies its reportable segments based on a management approach as described in ASC 280 Segment Reporting, together with additional factors such as nature of products or services, customer types, and certain economic characteristics of the underlying business. Our Chief Operating Decision Maker ("CODM") is our , Gregory Roberts.
The Company's operations are organized under
Revenue
in thousands |
|
|
Year Ended June 30, |
|||||||||||||
|
|
|
2026 |
|
|
|
2025 |
|
|
|
2024 |
|
|
|||
Revenue by segment (1) |
|
|
|
|
|
|
|
|
|
|
|
|
|
|||
Wholesale Sales & Ancillary Services |
|
|
$ |
|
|
|
$ |
|
|
|
$ |
|
|
|||
Eliminations of inter-segment sales |
|
|
|
( |
) |
|
|
|
( |
) |
|
|
|
( |
) |
|
Wholesale Sales & Ancillary Services, net of eliminations (2) |
|
|
|
|
|
|
|
|
|
|
|
|
|
|||
Direct-to-Consumer |
|
|
|
|
(a) |
|
|
|
(b) |
|
|
|
(c) |
|||
|
|
|
$ |
|
|
|
$ |
|
|
|
$ |
|
|
|||
119
in thousands |
|
|
Year Ended June 30, |
|
|||||||||||
|
|
|
2026 |
|
|
|
2025 |
|
|
|
2024 |
|
|||
Revenue by geographic region |
|
|
|
|
|
|
|
|
|
|
|
|
|||
United States |
|
|
$ |
|
|
|
$ |
|
|
|
$ |
|
|||
Europe |
|
|
|
|
|
|
|
|
|
|
|
|
|||
Canada |
|
|
|
|
|
|
|
|
|
|
|
|
|||
Asia Pacific |
|
|
|
|
|
|
|
|
|
|
|
|
|||
Africa |
|
|
|
|
|
|
|
|
|
|
|
|
|||
Australia |
|
|
|
|
|
|
|
|
|
|
|
|
|||
South America |
|
|
|
|
|
|
|
|
|
|
|
|
|||
|
|
|
$ |
|
|
|
$ |
|
|
|
$ |
|
|||
Cost of Sales
in thousands |
|
|
Year Ended June 30, |
|
|||||||||||
|
|
|
2026 |
|
|
|
2025 |
|
|
|
2024 |
|
|||
Cost of sales by segment(1) |
|
|
|
|
|
|
|
|
|
|
|
|
|||
Wholesale Sales & Ancillary Services |
|
|
$ |
|
|
|
$ |
|
|
|
$ |
|
|||
Eliminations and adjustments |
|
|
|
( |
) |
|
|
|
( |
) |
|
|
|
( |
) |
Wholesale Sales & Ancillary Services, net of eliminations and adjustments |
|
|
|
|
|
|
|
|
|
|
|
|
|||
Direct-to-Consumer, net of eliminations |
|
|
|
|
|
|
|
|
|
|
|
|
|||
|
|
|
$ |
|
|
|
$ |
|
|
|
$ |
|
|||
Gross Profit and Gross Margin Percentage
in thousands |
|
|
Year Ended June 30, |
|
|||||||||||
|
|
|
2026 |
|
|
|
2025 |
|
|
|
2024 |
|
|||
Gross profit by segment(1) |
|
|
|
|
|
|
|
|
|
|
|
|
|||
Wholesale Sales & Ancillary Services |
|
|
$ |
|
|
|
$ |
|
|
|
$ |
|
|||
Eliminations and adjustments |
|
|
|
|
|
|
|
|
|
|
|
|
|||
Wholesale Sales & Ancillary Services, net of eliminations and adjustments |
|
|
|
|
|
|
|
|
|
|
|
|
|||
Direct-to-Consumer, net of eliminations |
|
|
|
|
|
|
|
|
|
|
|
|
|||
|
|
|
$ |
|
|
|
$ |
|
|
|
$ |
|
|||
Gross margin percentage by segment |
|
|
|
|
|
|
|
|
|
|
|
|
|||
Wholesale Sales & Ancillary Services |
|
|
|
% |
|
|
|
% |
|
|
|
% |
|||
Wholesale Sales & Ancillary Services, net of eliminations and adjustments |
|
|
|
% |
|
|
|
% |
|
|
|
% |
|||
Direct-to-Consumer |
|
|
|
% |
|
|
|
% |
|
|
|
% |
|||
Consolidated gross margin percentage |
|
|
|
% |
|
|
|
% |
|
|
|
% |
|||
120
Operating Income and (Expenses)
in thousands |
|
|
Year Ended June 30, |
|
|||||||||||
|
|
|
2026 |
|
|
|
2025 |
|
|
|
2024 |
|
|||
Operating income (expenses) by segment |
|
|
|
|
|
|
|
|
|
|
|
|
|||
Wholesale Sales & Ancillary Services |
|
|
$ |
( |
) |
|
|
$ |
( |
) |
|
|
$ |
( |
) |
Eliminations |
|
|
|
( |
) |
|
|
|
( |
) |
|
|
|
( |
) |
Wholesale Sales & Ancillary Services, net of eliminations |
|
|
$ |
( |
) |
|
|
$ |
( |
) |
|
|
$ |
( |
) |
|
|
|
|
|
|
|
|
|
|
|
|
|
|||
Wholesale Sales & Ancillary Services, net of eliminations |
|
|
|
|
|
|
|
|
|
|
|
|
|||
Selling, general, and administrative expenses |
|
|
$ |
( |
) |
|
|
$ |
( |
) |
|
|
$ |
( |
) |
Depreciation and amortization expense |
|
|
|
( |
) |
|
|
|
( |
) |
|
|
|
( |
) |
Interest income |
|
|
|
|
|
|
|
|
|
|
|
|
|||
Interest expense |
|
|
|
( |
) |
|
|
|
( |
) |
|
|
|
( |
) |
Earnings (losses) from equity method investments |
|
|
|
|
|
|
|
( |
) |
|
|
|
|
||
Other (expense) income, net |
|
|
|
( |
) |
|
|
|
|
|
|
|
|
||
Remeasurement gain (loss) on pre-existing equity interests |
|
|
|
|
|
|
|
( |
) |
|
|
|
|
||
Gains (losses) on foreign exchange |
|
|
|
|
|
|
|
( |
) |
|
|
|
|
||
|
|
|
$ |
( |
) |
|
|
$ |
( |
) |
|
|
$ |
( |
) |
Direct-to-Consumer |
|
|
|
|
|
|
|
|
|
|
|
|
|||
Selling, general, and administrative expenses |
|
|
$ |
( |
) |
|
|
$ |
( |
) |
|
|
$ |
( |
) |
Depreciation and amortization expense |
|
|
|
( |
) |
|
|
|
( |
) |
|
|
|
( |
) |
Interest income |
|
|
|
|
|
|
|
|
|
|
|
|
|||
Interest expense |
|
|
|
( |
) |
|
|
|
( |
) |
|
|
|
( |
) |
Earnings from equity method investments |
|
|
|
|
|
|
|
|
|
|
|
|
|||
Other income, net |
|
|
|
|
|
|
|
|
|
|
|
|
|||
Gains (losses) on foreign exchange |
|
|
|
( |
) |
|
|
|
( |
) |
|
|
|
|
|
|
|
|
$ |
( |
) |
|
|
$ |
( |
) |
|
|
$ |
( |
) |
Secured Lending |
|
|
|
|
|
|
|
|
|
|
|
|
|||
Selling, general, and administrative expenses |
|
|
$ |
( |
) |
|
|
$ |
( |
) |
|
|
$ |
( |
) |
Depreciation and amortization expense |
|
|
|
( |
) |
|
|
|
( |
) |
|
|
|
( |
) |
Interest income |
|
|
|
|
|
|
|
|
|
|
|
|
|||
Interest expense |
|
|
|
( |
) |
|
|
|
( |
) |
|
|
|
( |
) |
Earnings from equity method investments |
|
|
|
|
|
|
|
|
|
|
|
|
|||
Other income, net |
|
|
|
|
|
|
|
|
|
|
|
|
|||
|
|
|
$ |
|
|
|
$ |
|
|
|
$ |
|
|||
Net Income (Loss) Before Provision for Income Taxes
in thousands |
|
|
Year Ended June 30, |
|
|||||||||||
|
|
|
2026 |
|
|
|
2025 |
|
|
|
2024 |
|
|||
Net income (loss) before provision for income taxes by segment |
|
|
|
|
|
|
|
|
|
|
|
|
|||
Wholesale Sales & Ancillary Services |
|
|
$ |
( |
) |
|
|
$ |
( |
) |
|
|
$ |
|
|
Direct-to-Consumer |
|
|
|
|
|
|
|
|
|
|
|
|
|||
Secured Lending |
|
|
|
|
|
|
|
|
|
|
|
|
|||
|
|
|
$ |
|
|
|
$ |
|
|
|
$ |
|
|||
Advertising Expense
in thousands |
|
|
Year Ended June 30, |
|
|||||||||||
|
|
|
2026 |
|
|
|
2025 |
|
|
|
2024 |
|
|||
Advertising expense by segment |
|
|
|
|
|
|
|
|
|
|
|
|
|||
Wholesale Sales & Ancillary Services |
|
|
$ |
( |
) |
|
|
$ |
( |
) |
|
|
$ |
( |
) |
Direct-to-Consumer |
|
|
|
( |
) |
|
|
|
( |
) |
|
|
|
( |
) |
Secured Lending |
|
|
|
( |
) |
|
|
|
( |
) |
|
|
|
( |
) |
|
|
|
$ |
( |
) |
|
|
$ |
( |
) |
|
|
$ |
( |
) |
121
Capital Expenditures for Long-Lived Assets
in thousands |
|
|
Year Ended June 30, |
|
|||||||||||
|
|
|
2026 |
|
|
|
2025 |
|
|
|
2024 |
|
|||
Capital expenditures for long-lived assets by segment |
|
|
|
|
|
|
|
|
|
|
|
|
|||
Wholesale Sales & Ancillary Services |
|
|
$ |
( |
) |
|
|
$ |
( |
) |
|
|
$ |
( |
) |
Direct-to-Consumer |
|
|
|
( |
) |
|
|
|
( |
) |
|
|
|
( |
) |
|
|
|
$ |
( |
) |
|
|
$ |
( |
) |
|
|
$ |
( |
) |
Inventories
in thousands |
|
|
|
|
|
|
|
||
|
|
June 30, 2026 |
|
|
|
June 30, 2025 |
|
||
Inventories by segment |
|
|
|
|
|
|
|
||
Wholesale Sales & Ancillary Services |
|
$ |
|
|
|
$ |
|
||
Direct-to-Consumer |
|
|
|
|
|
|
|
||
|
|
$ |
|
|
|
$ |
|
||
in thousands |
|
|
|
|
|
|
|
||
|
|
June 30, 2026 |
|
|
|
June 30, 2025 |
|
||
Inventories by geographic region |
|
|
|
|
|
|
|
||
United States |
|
$ |
|
|
|
$ |
|
||
Canada |
|
|
|
|
|
|
|
||
Europe |
|
|
|
|
|
|
|
||
Asia |
|
|
|
|
|
|
|
||
|
|
$ |
|
|
|
$ |
|
||
Total Assets
in thousands |
|
|
|
|
|
|
|
||
|
|
June 30, 2026 |
|
|
|
June 30, 2025 |
|
||
Total assets by segment |
|
|
|
|
|
|
|
||
Wholesale Sales & Ancillary Services (1) |
|
$ |
|
|
|
$ |
|
||
Eliminations |
|
|
( |
) |
|
|
|
( |
) |
Wholesale Sales & Ancillary Services, net of eliminations |
|
|
|
|
|
|
|
||
Direct-to-Consumer |
|
|
|
|
|
|
|
||
Secured Lending |
|
|
|
|
|
|
|
||
|
|
$ |
|
|
|
$ |
|
||
in thousands |
|
|
|
|
|
|
|
||
|
|
June 30, 2026 |
|
|
|
June 30, 2025 |
|
||
Total assets by geographic region |
|
|
|
|
|
|
|
||
United States |
|
$ |
|
|
|
$ |
|
||
North America, excluding United States |
|
|
|
|
|
|
|
||
Europe |
|
|
|
|
|
|
|
||
Asia |
|
|
|
|
|
|
|
||
|
|
$ |
|
|
|
$ |
|
||
Long-term Assets
in thousands |
|
|
|
|
|
|
|
||
|
|
June 30, 2026 |
|
|
|
June 30, 2025 |
|
||
Long-term assets by segment |
|
|
|
|
|
|
|
||
Wholesale Sales & Ancillary Services |
|
$ |
|
|
|
$ |
|
||
Direct-to-Consumer |
|
|
|
|
|
|
|
||
Secured Lending |
|
|
|
|
|
|
|
||
|
|
$ |
|
|
|
$ |
|
||
in thousands |
|
|
|
|
|
|
|
||
|
|
June 30, 2026 |
|
|
|
June 30, 2025 |
|
||
Long-term assets by geographic region |
|
|
|
|
|
|
|
||
United States |
|
$ |
|
|
|
$ |
|
||
North America, excluding United States |
|
|
|
|
|
|
|
||
Europe |
|
|
|
|
|
|
|
||
Asia |
|
|
|
|
|
|
|
||
|
|
$ |
|
|
|
$ |
|
||
122
Goodwill
in thousands |
|
|
|
|
|
|
|
||
|
|
June 30, 2026 |
|
|
|
June 30, 2025 |
|
||
Goodwill by segment |
|
|
|
|
|
|
|
||
Wholesale Sales & Ancillary Services |
|
$ |
|
|
|
$ |
|
||
Direct-to-Consumer(1) |
|
|
|
|
|
|
|
||
|
|
$ |
|
|
|
$ |
|
||
Intangible assets
in thousands |
|
|
|
|
|
|
|
||
|
|
June 30, 2026 |
|
|
|
June 30, 2025 |
|
||
Intangible assets by segment |
|
|
|
|
|
|
|
||
Wholesale Sales & Ancillary Services |
|
$ |
|
|
|
$ |
|
||
Direct-to-Consumer(1) |
|
|
|
|
|
|
|
||
|
|
$ |
|
|
|
$ |
|
||
20. SUBSEQUENT EVENTS
Dividend
As announced on
ITEM 9. CHANGES IN AND DISAGREEMENTS WITH ACCOUNTANTS ON ACCOUNTING AND FINANCIAL DISCLOSURE
None.
ITEM 9A. CONTROLS AND PROCEDURES
Disclosure Controls and Procedures
Under the supervision and with the participation of our management, including our Chief Executive Officer and President (our "Certifying Officers"), we carried out an evaluation of the effectiveness of the design and operation of our disclosure controls and procedures as defined in Rules 13a-15(e) and 15d-15(e) under the Securities Exchange Act of 1934 (the “Exchange Act”). Based on the foregoing, our Certifying Officers concluded that our disclosure controls and procedures were effective as of the end of the period covered by this Annual Report.
Disclosure controls and procedures are controls and other procedures designed to ensure that information required to be disclosed in our reports filed or submitted under the Exchange Act is recorded, processed, summarized and reported within the time periods specified in the SEC’s rules and forms. Disclosure controls and procedures include, without limitation, controls and procedures designed to ensure that information required to be disclosed in our reports filed or submitted under the Exchange Act is accumulated and communicated to management, including our Certifying Officers, or persons performing similar functions, as appropriate, to allow timely decisions regarding required disclosure.
Management’s Annual Report on Internal Control Over Financial Reporting
The financial statements were prepared by management, which is responsible for their integrity and objectivity and for establishing and maintaining adequate internal control over financial reporting.
The Company’s internal control over financial reporting is designed to provide reasonable assurance regarding the reliability of financial reporting and the preparation of financial statements for external purposes in accordance with generally accepted accounting principles. The Company’s internal control over financial reporting includes those policies and procedures that:
|
i. |
pertain to the maintenance of records that, in reasonable detail, accurately and fairly reflect |
123
|
ii. |
provide reasonable assurance that transactions are recorded as necessary to permit preparation of financial statements in accordance with generally accepted accounting principles, and that receipts and expenditures of the Company are being made only in accordance with authorizations of management and directors of the Company; and |
|
iii. |
provide reasonable assurance regarding prevention or timely detection of unauthorized acquisition, use or disposition of the Company’s assets that could have a material effect on the financial statements. |
There are inherent limitations in the effectiveness of any internal control, including the possibility of human error and the circumvention or overriding of controls. Accordingly, even effective internal controls can provide only reasonable assurances with respect to financial statement preparation. Further, because of changes in conditions, the effectiveness of internal controls may vary over time.
Management assessed the design and effectiveness of the Company’s internal control over financial reporting as of June 30, 2026. In making this assessment, management used the criteria set forth by the Committee of Sponsoring Organizations of the Treadway Commission (“COSO”) in Internal Control—Integrated Framework ("2013 framework"). Based on this evaluation, management concluded that our internal control over financial reporting was effective as of June 30, 2026 based on criteria in Internal Control –Integrated Framework issued by the COSO.
Management's evaluation of the effectiveness of the Company's internal control over financial reporting as of June 30, 2026 did not include internal controls over financial reporting for Monex or SMI that we acquired in January 2026 and April 2026, respectively. Monex comprised approximately 20% of our total assets as of June 30, 2026 and approximately 1% of our total revenues for the year ended June 30, 2026. SMI comprised approximately 2% of our total assets as of June 30, 2026 and less than 1% of our total revenues for the year ended June 30, 2026.
Grant Thornton LLP, an independent registered public accounting firm, has issued its report on the Company’s internal control over financial reporting as of June 30, 2026, which appears elsewhere in this Form 10-K.
Changes in Internal Control over Financial Reporting
During our most recent fiscal quarter, there has not been any change in the Company’s internal control over financial reporting (as such term is defined in Rules 13a-15(f) and 15d-15(f) under the Exchange Act) that has materially affected, or is reasonably likely to materially affect, the Company’s internal control over financial reporting.
ITEM 9B. OTHER INFORMATION
ITEM 9C. DISCLOSURE REGARDING FOREIGN JURISDICTIONS THAT PREVENT INSPECTIONS
None.
124
PART III
ITEM 10. DIRECTORS, EXECUTIVE OFFICERS AND CORPORATE GOVERNANCE
Incorporated by reference to the Company’s Proxy Statement, to be filed within 120 days following June 30, 2026.
ITEM 11. EXECUTIVE COMPENSATION
Incorporated by reference to the Company’s Proxy Statement, to be filed within 120 days following June 30, 2026.
ITEM 12. SECURITY OWNERSHIP OF CERTAIN BENEFICIAL OWNERS AND MANAGEMENT AND RELATED STOCKHOLDER MATTERS
Incorporated by reference to the Company’s Proxy Statement, to be filed within 120 days following June 30, 2026.
ITEM 13. CERTAIN RELATIONSHIPS AND RELATED TRANSACTIONS, AND DIRECTOR INDEPENDENCE
Incorporated by reference to the Company’s Proxy Statement, to be filed within 120 days following June 30, 2026.
ITEM 14. PRINCIPAL ACCOUNTANT FEES AND SERVICES
Incorporated by reference to the Company’s Proxy Statement, to be filed within 120 days following June 30, 2026.
125
PART IV
ITEM 15. EXHIBITS AND FINANCIAL STATEMENT SCHEDULES
(a) |
The following documents are filed as part of this report: |
1. |
Financial Statements |
Index to Consolidated Financial Statements |
|
Page |
|
68 |
|
|
70 |
|
|
71 |
|
|
72 |
|
|
73 |
|
|
74 |
2. |
Financial Statements Schedules: |
|
None. |
3. |
Exhibits required to be filed by Item 601 of Regulation S-K: |
Exhibit Index
Exhibit No. |
|
Description of Exhibit |
3.1.1** |
|
|
|
|
|
3.1.2** |
|
|
|
|
|
3.2** |
|
|
|
|
|
3.3**^ |
|
|
|
|
|
4.1** |
|
|
|
|
|
10.05**^ |
|
|
|
|
|
10.06**^ |
|
|
|
|
|
10.07**^ |
|
|
|
|
|
10.08**^ |
|
|
10.09**^ |
|
|
|
|
|
10.10**^ |
|
|
|
|
|
10.11^** |
|
126
|
|
|
10.12^** |
|
|
|
|
|
10.14^** |
|
|
|
|
|
10.15^** |
|
|
|
|
|
10.16** |
|
|
|
|
|
10.17** |
|
|
|
|
|
10.18** |
|
|
|
|
|
10.19** |
|
|
|
|
|
10.20* |
|
|
|
|
|
10.21* |
|
|
|
|
|
10.22* |
|
|
|
|
|
10.23* |
|
|
|
|
|
10.25** |
|
|
|
|
|
10.26** |
|
|
|
|
|
10.27** |
|
|
|
|
|
10.28** |
|
|
|
|
|
10.29** |
|
|
|
|
|
10.30** |
|
|
|
|
|
10.31** |
|
|
|
|
|
10.32**^ |
|
|
|
|
|
10.33**
|
|
|
|
|
|
10.34** |
|
|
|
|
|
127
14.1** |
|
|
|
|
|
19** |
|
|
|
|
|
21* |
|
|
|
|
|
23.1* |
|
Consent of Grant Thornton LLP, independent registered public accounting firm. |
|
|
|
31.1* |
|
Certification Under Section 302 of the Sarbanes-Oxley Act of 2002. |
|
|
|
31.2* |
|
Certification Under Section 302 of the Sarbanes-Oxley Act of 2002. |
|
|
|
32.1* |
|
Certification Under Section 906 of the Sarbanes-Oxley Act of 2002. |
|
|
|
32.2* |
|
Certification Under Section 906 of the Sarbanes-Oxley Act of 2002. |
|
|
|
97**^ |
|
|
|
|
|
101.INS* |
|
Inline XBRL Instance Document. |
|
|
|
101.SCH* |
|
Inline XBRL Taxonomy Extension Schema with Embedded Linkbase Documents. |
|
|
|
104* |
|
Cover Page interactive Data File (formatted as Inline XBRL and contained in Exhibit 101) |
|
|
|
__________________
* Filed herewith
** Previously filed
^ Indicates management contract or compensatory plan or arrangement.
ITEM 16. FORM 10-K SUMMARY
None.
128
SIGNATURES
Pursuant to the requirements of Section 13 or 15(d) of the Securities Exchange Act of 1934, the registrant has duly caused this report to be signed on its behalf by the undersigned thereunto duly authorized.
|
|
GOLD.COM, INC. |
|
||
|
|
|
|
|
|
Date: |
September 9, 2026 |
By: |
/s/ Gregory N. Roberts |
|
|
|
|
|
Gregory N. Roberts |
|
|
|
|
|
Chief Executive Officer |
|
|
|
|
|
(Principal Executive Officer) |
|
|
|
|
|
|
|
|
Date: |
September 9, 2026 |
By: |
/s/ Cary Dickson |
|
|
|
|
|
Cary Dickson |
|
|
|
|
|
Chief Financial Officer |
|
|
|
|
|
(Principal Financial Officer and Principal Accounting Officer) |
|
|
Pursuant to the requirements of the Securities Exchange Act of 1934, this report has been signed below by the following persons on behalf of the registrant and in the capacities and on the dates indicated.
Signatures |
|
Title(s) |
|
Date |
|
|
|
|
|
/s/ Jeffrey D. Benjamin |
|
Director |
|
September 9, 2026 |
Jeffrey D. Benjamin |
|
(Chairman of the Board of Directors) |
|
|
|
|
|
|
|
/s/ Gregory N. Roberts |
|
Chief Executive Officer and Director |
|
September 9, 2026 |
Gregory N. Roberts |
|
(Principal Executive Officer) |
|
|
|
|
|
|
|
/s/ Cary Dickson |
|
Chief Financial Officer |
|
September 9, 2026 |
Cary Dickson |
|
(Principal Financial Officer and Principal Accounting Officer) |
|
|
|
|
|
|
|
/s/ Ellis Landau |
|
Director |
|
September 9, 2026 |
Ellis Landau |
|
|
|
|
|
|
|
|
|
/s/ Carol Meltzer |
|
Director |
|
September 9, 2026 |
Carol Meltzer |
|
|
|
|
|
|
|
|
|
/s/ John U. Moorhead |
|
Director |
|
September 9, 2026 |
John U. Moorhead |
|
|
|
|
|
|
|
|
|
/s/ Jess M. Ravich |
|
Director |
|
September 9, 2026 |
Jess M. Ravich |
|
|
|
|
|
|
|
|
|
/s/ Monique Sanchez |
|
Director |
|
September 9, 2026 |
Monique Sanchez |
|
|
|
|
|
|
|
|
|
/s/ Kendall Saville |
|
Director |
|
September 9, 2026 |
Kendall Saville |
|
|
|
|
|
|
|
|
|
/s/ Juan Sartori |
|
Director |
|
September 9, 2026 |
Juan Sartori |
|
|
|
|
|
|
|
|
|
/s/ Michael R. Wittmeyer |
|
Director |
|
September 9, 2026 |
Michael R. Wittmeyer |
|
|
|
|
129